Indonesian vs Colville 2 or more Vehicles in Household
COMPARE
Indonesian
Colville
2 or more Vehicles in Household
2 or more Vehicles in Household Comparison
Indonesians
Colville
53.4%
2 OR MORE VEHICLES IN HOUSEHOLD
2.7/ 100
METRIC RATING
236th/ 347
METRIC RANK
55.6%
2 OR MORE VEHICLES IN HOUSEHOLD
61.1/ 100
METRIC RATING
161st/ 347
METRIC RANK
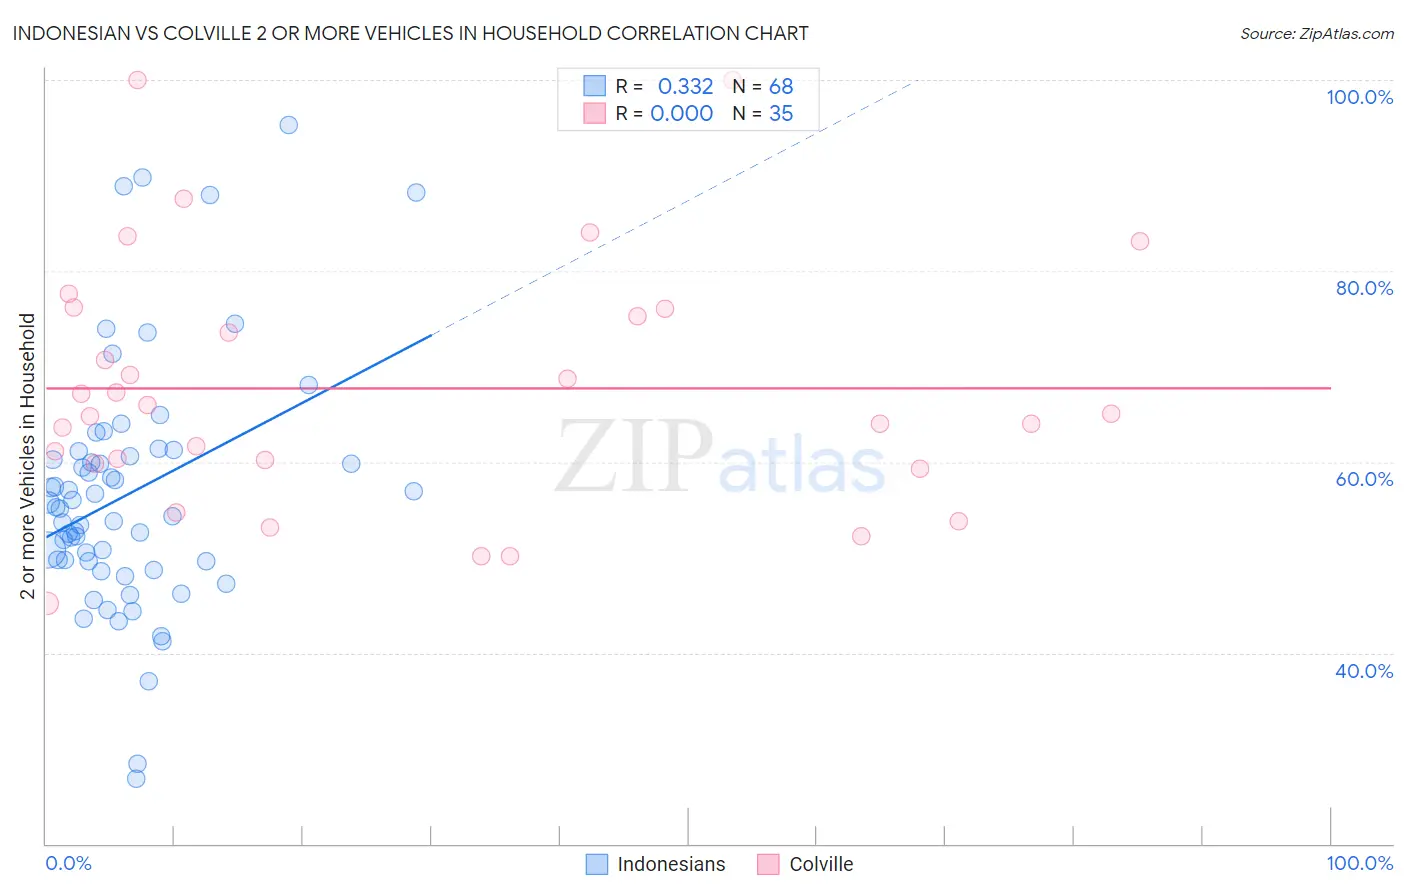
Indonesian vs Colville 2 or more Vehicles in Household Correlation Chart
The statistical analysis conducted on geographies consisting of 162,658,811 people shows a mild positive correlation between the proportion of Indonesians and percentage of households with 2 or more vehicles available in the United States with a correlation coefficient (R) of 0.332 and weighted average of 53.4%. Similarly, the statistical analysis conducted on geographies consisting of 34,683,092 people shows no correlation between the proportion of Colville and percentage of households with 2 or more vehicles available in the United States with a correlation coefficient (R) of 0.000 and weighted average of 55.6%, a difference of 4.2%.
2 or more Vehicles in Household Correlation Summary
| Measurement | Indonesian | Colville |
| Minimum | 26.8% | 45.2% |
| Maximum | 95.3% | 100.0% |
| Range | 68.6% | 54.8% |
| Mean | 56.7% | 67.7% |
| Median | 55.1% | 65.0% |
| Interquartile 25% (IQ1) | 49.6% | 59.8% |
| Interquartile 75% (IQ3) | 60.8% | 76.1% |
| Interquartile Range (IQR) | 11.2% | 16.3% |
| Standard Deviation (Sample) | 13.1% | 13.2% |
| Standard Deviation (Population) | 13.0% | 13.0% |
Similar Demographics by 2 or more Vehicles in Household
Demographics Similar to Indonesians by 2 or more Vehicles in Household
In terms of 2 or more vehicles in household, the demographic groups most similar to Indonesians are Immigrants from Middle Africa (53.4%, a difference of 0.10%), Macedonian (53.3%, a difference of 0.11%), Immigrants from Switzerland (53.4%, a difference of 0.13%), Ugandan (53.5%, a difference of 0.18%), and Immigrants from Armenia (53.3%, a difference of 0.18%).
| Demographics | Rating | Rank | 2 or more Vehicles in Household |
| Immigrants | Turkey | 3.8 /100 | #229 | Tragic 53.6% |
| Immigrants | Nepal | 3.6 /100 | #230 | Tragic 53.5% |
| Panamanians | 3.4 /100 | #231 | Tragic 53.5% |
| Immigrants | Guatemala | 3.2 /100 | #232 | Tragic 53.5% |
| Ugandans | 3.2 /100 | #233 | Tragic 53.5% |
| Immigrants | Switzerland | 3.0 /100 | #234 | Tragic 53.4% |
| Immigrants | Middle Africa | 3.0 /100 | #235 | Tragic 53.4% |
| Indonesians | 2.7 /100 | #236 | Tragic 53.4% |
| Macedonians | 2.4 /100 | #237 | Tragic 53.3% |
| Immigrants | Armenia | 2.3 /100 | #238 | Tragic 53.3% |
| Cambodians | 2.3 /100 | #239 | Tragic 53.3% |
| Immigrants | Europe | 2.1 /100 | #240 | Tragic 53.2% |
| Immigrants | Sierra Leone | 2.1 /100 | #241 | Tragic 53.2% |
| Immigrants | Eastern Asia | 2.1 /100 | #242 | Tragic 53.2% |
| Ethiopians | 1.7 /100 | #243 | Tragic 53.1% |
Demographics Similar to Colville by 2 or more Vehicles in Household
In terms of 2 or more vehicles in household, the demographic groups most similar to Colville are German Russian (55.6%, a difference of 0.010%), Immigrants from Zimbabwe (55.6%, a difference of 0.040%), Dutch West Indian (55.6%, a difference of 0.050%), Immigrants from El Salvador (55.6%, a difference of 0.070%), and Immigrants from Sri Lanka (55.5%, a difference of 0.12%).
| Demographics | Rating | Rank | 2 or more Vehicles in Household |
| Ukrainians | 70.8 /100 | #154 | Good 55.8% |
| Immigrants | Venezuela | 70.7 /100 | #155 | Good 55.8% |
| Immigrants | Lithuania | 70.4 /100 | #156 | Good 55.8% |
| Immigrants | Kuwait | 70.2 /100 | #157 | Good 55.8% |
| Tlingit-Haida | 68.5 /100 | #158 | Good 55.8% |
| Paiute | 68.0 /100 | #159 | Good 55.8% |
| Crow | 67.0 /100 | #160 | Good 55.7% |
| Colville | 61.1 /100 | #161 | Good 55.6% |
| German Russians | 60.9 /100 | #162 | Good 55.6% |
| Immigrants | Zimbabwe | 60.2 /100 | #163 | Good 55.6% |
| Dutch West Indians | 59.8 /100 | #164 | Average 55.6% |
| Immigrants | El Salvador | 59.4 /100 | #165 | Average 55.6% |
| Immigrants | Sri Lanka | 58.3 /100 | #166 | Average 55.5% |
| Kenyans | 58.1 /100 | #167 | Average 55.5% |
| French American Indians | 56.7 /100 | #168 | Average 55.5% |