Indonesian vs Colville In Labor Force | Age 20-24
COMPARE
Indonesian
Colville
In Labor Force | Age 20-24
In Labor Force | Age 20-24 Comparison
Indonesians
Colville
77.2%
IN LABOR FORCE | AGE 20-24
100.0/ 100
METRIC RATING
52nd/ 347
METRIC RANK
73.9%
IN LABOR FORCE | AGE 20-24
1.5/ 100
METRIC RATING
247th/ 347
METRIC RANK
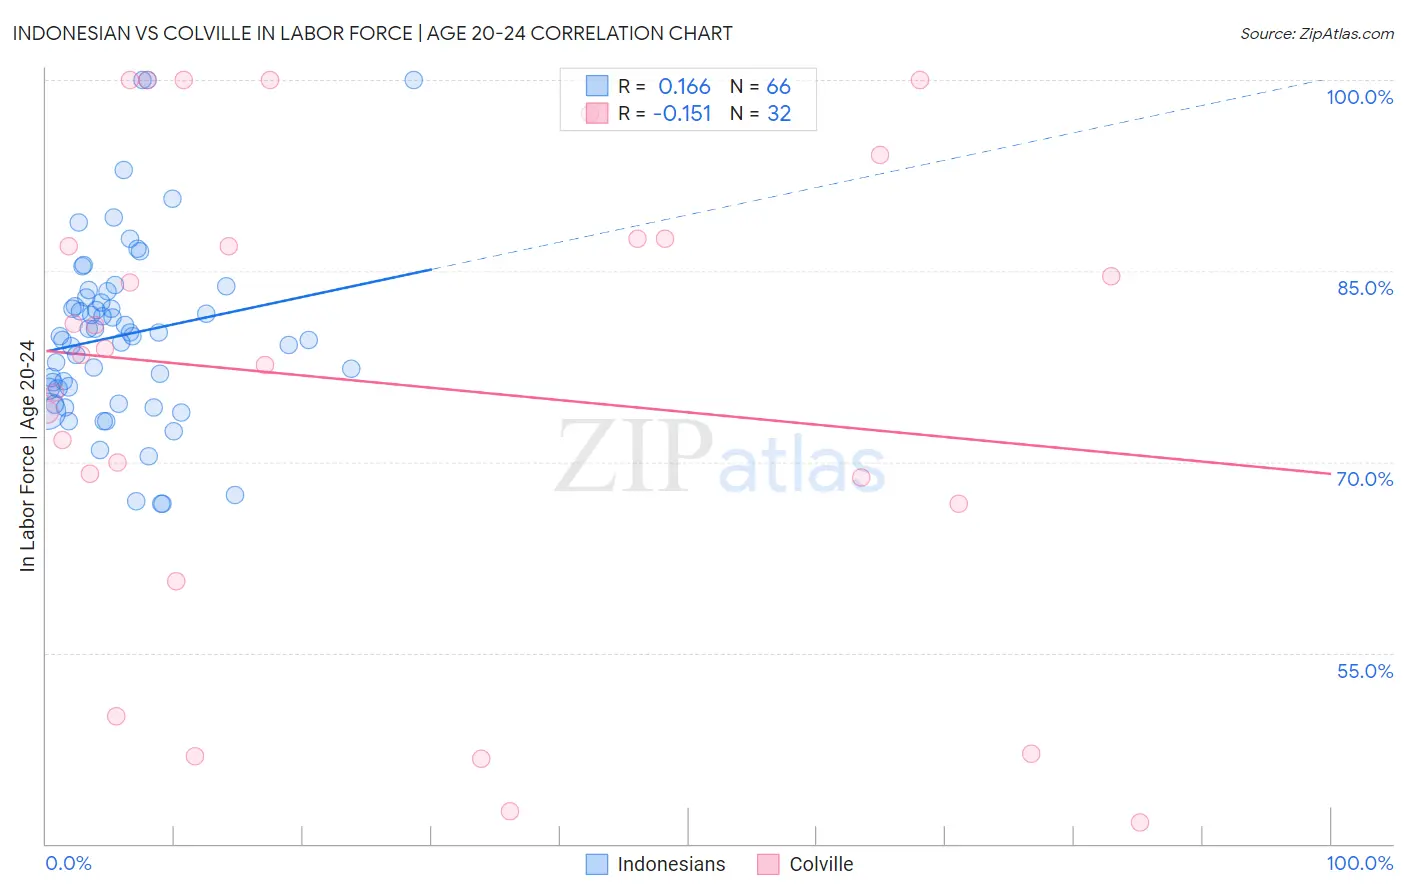
Indonesian vs Colville In Labor Force | Age 20-24 Correlation Chart
The statistical analysis conducted on geographies consisting of 162,737,934 people shows a poor positive correlation between the proportion of Indonesians and labor force participation rate among population between the ages 20 and 24 in the United States with a correlation coefficient (R) of 0.166 and weighted average of 77.2%. Similarly, the statistical analysis conducted on geographies consisting of 34,682,929 people shows a poor negative correlation between the proportion of Colville and labor force participation rate among population between the ages 20 and 24 in the United States with a correlation coefficient (R) of -0.151 and weighted average of 73.9%, a difference of 4.5%.
In Labor Force | Age 20-24 Correlation Summary
| Measurement | Indonesian | Colville |
| Minimum | 66.7% | 41.7% |
| Maximum | 100.0% | 100.0% |
| Range | 33.3% | 58.3% |
| Mean | 80.0% | 76.1% |
| Median | 79.9% | 78.6% |
| Interquartile 25% (IQ1) | 75.7% | 67.7% |
| Interquartile 75% (IQ3) | 82.9% | 87.5% |
| Interquartile Range (IQR) | 7.2% | 19.8% |
| Standard Deviation (Sample) | 7.1% | 18.3% |
| Standard Deviation (Population) | 7.1% | 18.0% |
Similar Demographics by In Labor Force | Age 20-24
Demographics Similar to Indonesians by In Labor Force | Age 20-24
In terms of in labor force | age 20-24, the demographic groups most similar to Indonesians are Croatian (77.2%, a difference of 0.010%), Immigrants from the Azores (77.2%, a difference of 0.010%), Malaysian (77.2%, a difference of 0.020%), Serbian (77.3%, a difference of 0.060%), and Chinese (77.3%, a difference of 0.060%).
| Demographics | Rating | Rank | In Labor Force | Age 20-24 |
| Native Hawaiians | 100.0 /100 | #45 | Exceptional 77.4% |
| Samoans | 100.0 /100 | #46 | Exceptional 77.4% |
| Ethiopians | 100.0 /100 | #47 | Exceptional 77.3% |
| Serbians | 100.0 /100 | #48 | Exceptional 77.3% |
| Chinese | 100.0 /100 | #49 | Exceptional 77.3% |
| Malaysians | 100.0 /100 | #50 | Exceptional 77.2% |
| Croatians | 100.0 /100 | #51 | Exceptional 77.2% |
| Indonesians | 100.0 /100 | #52 | Exceptional 77.2% |
| Immigrants | Azores | 100.0 /100 | #53 | Exceptional 77.2% |
| Celtics | 99.9 /100 | #54 | Exceptional 77.1% |
| Immigrants | Liberia | 99.9 /100 | #55 | Exceptional 77.1% |
| Europeans | 99.9 /100 | #56 | Exceptional 77.1% |
| Chippewa | 99.9 /100 | #57 | Exceptional 77.1% |
| Hawaiians | 99.9 /100 | #58 | Exceptional 77.0% |
| Scotch-Irish | 99.9 /100 | #59 | Exceptional 77.0% |
Demographics Similar to Colville by In Labor Force | Age 20-24
In terms of in labor force | age 20-24, the demographic groups most similar to Colville are Immigrants from Saudi Arabia (73.9%, a difference of 0.0%), Immigrants from Panama (73.9%, a difference of 0.030%), Black/African American (73.9%, a difference of 0.050%), Immigrants from Belgium (73.9%, a difference of 0.060%), and Turkish (73.9%, a difference of 0.070%).
| Demographics | Rating | Rank | In Labor Force | Age 20-24 |
| Immigrants | Sri Lanka | 2.3 /100 | #240 | Tragic 74.0% |
| Immigrants | Senegal | 2.1 /100 | #241 | Tragic 74.0% |
| Thais | 2.1 /100 | #242 | Tragic 74.0% |
| Immigrants | Syria | 1.9 /100 | #243 | Tragic 74.0% |
| Immigrants | South Central Asia | 1.9 /100 | #244 | Tragic 74.0% |
| Turks | 1.8 /100 | #245 | Tragic 73.9% |
| Immigrants | Panama | 1.6 /100 | #246 | Tragic 73.9% |
| Colville | 1.5 /100 | #247 | Tragic 73.9% |
| Immigrants | Saudi Arabia | 1.5 /100 | #248 | Tragic 73.9% |
| Blacks/African Americans | 1.3 /100 | #249 | Tragic 73.9% |
| Immigrants | Belgium | 1.3 /100 | #250 | Tragic 73.9% |
| Immigrants | Egypt | 1.2 /100 | #251 | Tragic 73.8% |
| Immigrants | Kazakhstan | 1.1 /100 | #252 | Tragic 73.8% |
| Arapaho | 1.0 /100 | #253 | Tragic 73.8% |
| Ute | 1.0 /100 | #254 | Tragic 73.8% |