Indonesian vs Colville Unemployment Among Ages 45 to 54 years
COMPARE
Indonesian
Colville
Unemployment Among Ages 45 to 54 years
Unemployment Among Ages 45 to 54 years Comparison
Indonesians
Colville
4.4%
UNEMPLOYMENT AMONG AGES 45 TO 54 YEARS
95.4/ 100
METRIC RATING
96th/ 347
METRIC RANK
7.4%
UNEMPLOYMENT AMONG AGES 45 TO 54 YEARS
0.0/ 100
METRIC RATING
338th/ 347
METRIC RANK
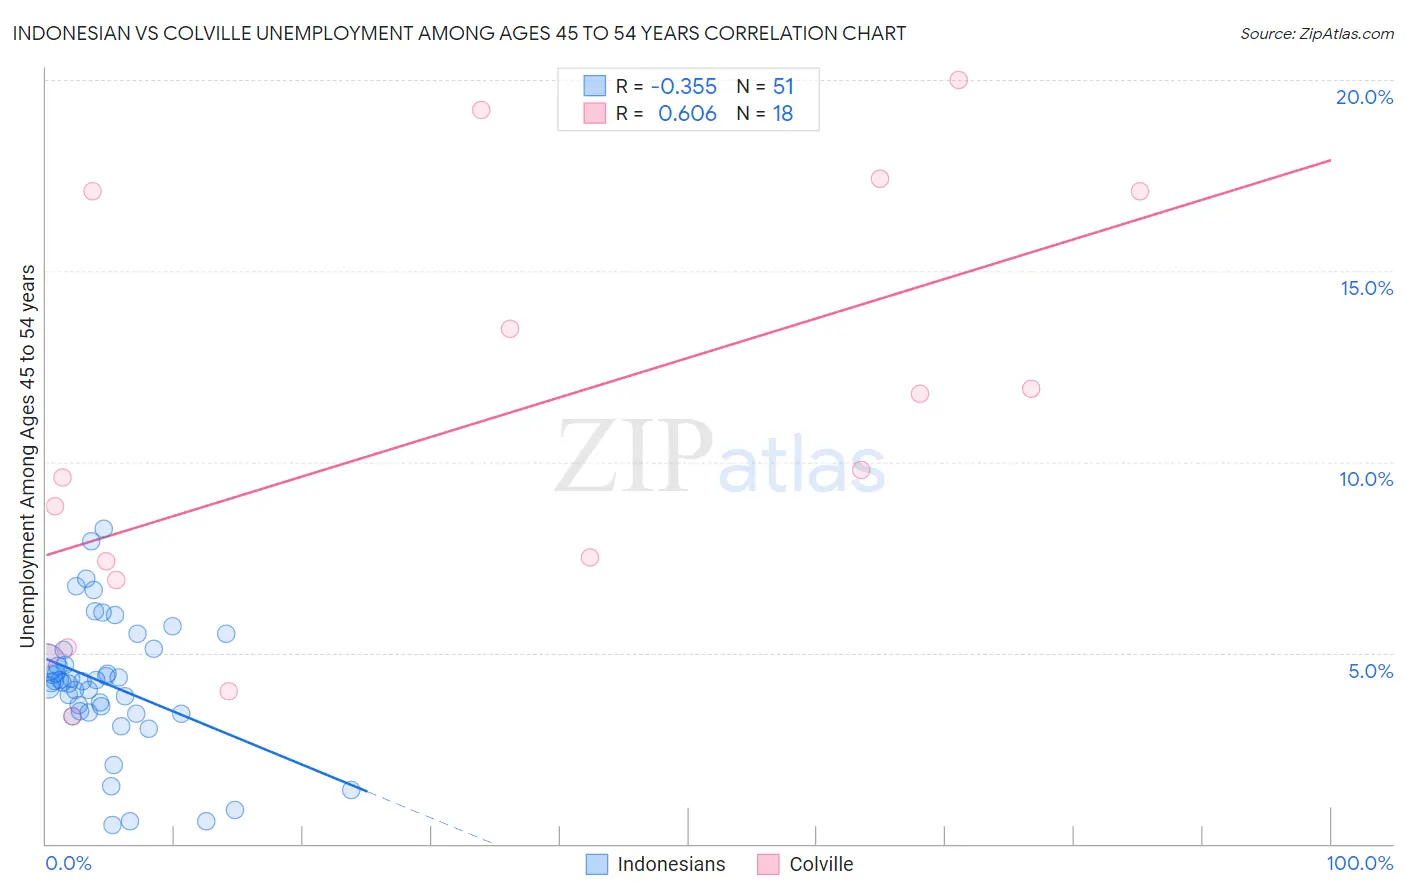
Indonesian vs Colville Unemployment Among Ages 45 to 54 years Correlation Chart
The statistical analysis conducted on geographies consisting of 161,009,785 people shows a mild negative correlation between the proportion of Indonesians and unemployment rate among population between the ages 45 and 54 in the United States with a correlation coefficient (R) of -0.355 and weighted average of 4.4%. Similarly, the statistical analysis conducted on geographies consisting of 34,483,294 people shows a significant positive correlation between the proportion of Colville and unemployment rate among population between the ages 45 and 54 in the United States with a correlation coefficient (R) of 0.606 and weighted average of 7.4%, a difference of 69.1%.
Unemployment Among Ages 45 to 54 years Correlation Summary
| Measurement | Indonesian | Colville |
| Minimum | 0.50% | 3.3% |
| Maximum | 8.3% | 20.0% |
| Range | 7.8% | 16.7% |
| Mean | 4.2% | 10.9% |
| Median | 4.3% | 9.7% |
| Interquartile 25% (IQ1) | 3.4% | 6.9% |
| Interquartile 75% (IQ3) | 5.1% | 17.1% |
| Interquartile Range (IQR) | 1.6% | 10.2% |
| Standard Deviation (Sample) | 1.7% | 5.4% |
| Standard Deviation (Population) | 1.7% | 5.3% |
Similar Demographics by Unemployment Among Ages 45 to 54 years
Demographics Similar to Indonesians by Unemployment Among Ages 45 to 54 years
In terms of unemployment among ages 45 to 54 years, the demographic groups most similar to Indonesians are Immigrants from Canada (4.4%, a difference of 0.13%), Romanian (4.4%, a difference of 0.13%), Immigrants from Burma/Myanmar (4.4%, a difference of 0.15%), Immigrants from Eritrea (4.4%, a difference of 0.18%), and Immigrants from Ethiopia (4.4%, a difference of 0.19%).
| Demographics | Rating | Rank | Unemployment Among Ages 45 to 54 years |
| Immigrants | Argentina | 96.9 /100 | #89 | Exceptional 4.3% |
| Asians | 96.8 /100 | #90 | Exceptional 4.3% |
| Ukrainians | 96.6 /100 | #91 | Exceptional 4.3% |
| Mongolians | 96.6 /100 | #92 | Exceptional 4.3% |
| Argentineans | 96.5 /100 | #93 | Exceptional 4.3% |
| Immigrants | Malaysia | 96.2 /100 | #94 | Exceptional 4.4% |
| Immigrants | Ethiopia | 96.1 /100 | #95 | Exceptional 4.4% |
| Indonesians | 95.4 /100 | #96 | Exceptional 4.4% |
| Immigrants | Canada | 95.0 /100 | #97 | Exceptional 4.4% |
| Romanians | 94.9 /100 | #98 | Exceptional 4.4% |
| Immigrants | Burma/Myanmar | 94.9 /100 | #99 | Exceptional 4.4% |
| Immigrants | Eritrea | 94.7 /100 | #100 | Exceptional 4.4% |
| Immigrants | North America | 93.9 /100 | #101 | Exceptional 4.4% |
| Sri Lankans | 93.7 /100 | #102 | Exceptional 4.4% |
| Icelanders | 93.5 /100 | #103 | Exceptional 4.4% |
Demographics Similar to Colville by Unemployment Among Ages 45 to 54 years
In terms of unemployment among ages 45 to 54 years, the demographic groups most similar to Colville are Arapaho (7.5%, a difference of 1.5%), Hopi (7.5%, a difference of 1.9%), Apache (7.0%, a difference of 5.0%), Paiute (7.8%, a difference of 5.5%), and Puerto Rican (6.8%, a difference of 8.5%).
| Demographics | Rating | Rank | Unemployment Among Ages 45 to 54 years |
| Tohono O'odham | 0.0 /100 | #331 | Tragic 6.3% |
| Pima | 0.0 /100 | #332 | Tragic 6.4% |
| Immigrants | Yemen | 0.0 /100 | #333 | Tragic 6.5% |
| Sioux | 0.0 /100 | #334 | Tragic 6.6% |
| Navajo | 0.0 /100 | #335 | Tragic 6.7% |
| Puerto Ricans | 0.0 /100 | #336 | Tragic 6.8% |
| Apache | 0.0 /100 | #337 | Tragic 7.0% |
| Colville | 0.0 /100 | #338 | Tragic 7.4% |
| Arapaho | 0.0 /100 | #339 | Tragic 7.5% |
| Hopi | 0.0 /100 | #340 | Tragic 7.5% |
| Paiute | 0.0 /100 | #341 | Tragic 7.8% |
| Alaskan Athabascans | 0.0 /100 | #342 | Tragic 8.5% |
| Inupiat | 0.0 /100 | #343 | Tragic 9.2% |
| Yuman | 0.0 /100 | #344 | Tragic 9.5% |
| Cheyenne | 0.0 /100 | #345 | Tragic 10.6% |