Indonesian vs Colville Female Poverty Among 18-24 Year Olds
COMPARE
Indonesian
Colville
Female Poverty Among 18-24 Year Olds
Female Poverty Among 18-24 Year Olds Comparison
Indonesians
Colville
22.5%
FEMALE POVERTY AMONG 18-24 YEAR OLDS
0.0/ 100
METRIC RATING
294th/ 347
METRIC RANK
29.0%
FEMALE POVERTY AMONG 18-24 YEAR OLDS
0.0/ 100
METRIC RATING
341st/ 347
METRIC RANK
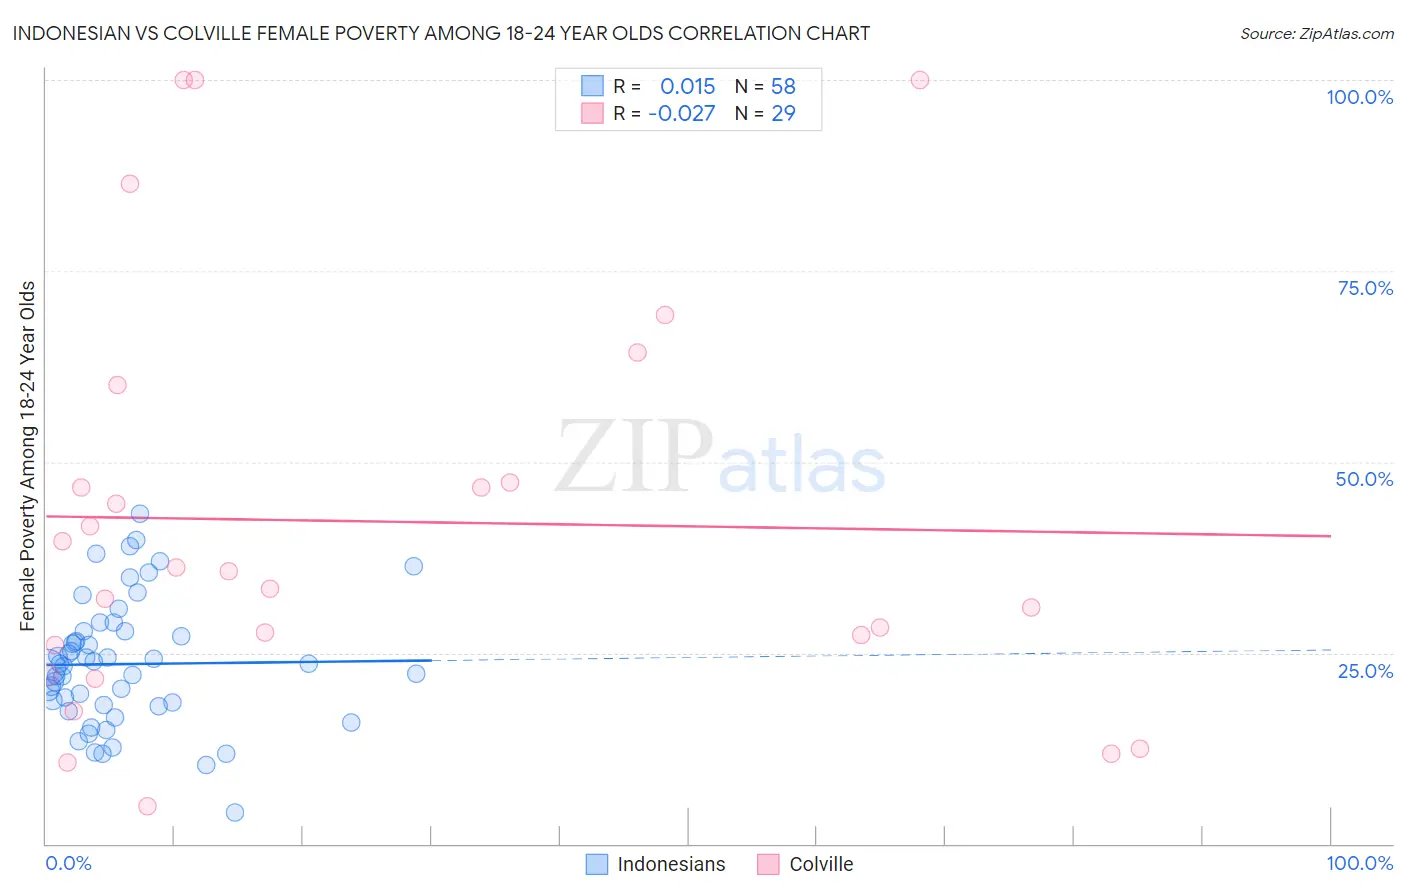
Indonesian vs Colville Female Poverty Among 18-24 Year Olds Correlation Chart
The statistical analysis conducted on geographies consisting of 161,434,241 people shows no correlation between the proportion of Indonesians and poverty level among females between the ages 18 and 24 in the United States with a correlation coefficient (R) of 0.015 and weighted average of 22.5%. Similarly, the statistical analysis conducted on geographies consisting of 34,585,372 people shows no correlation between the proportion of Colville and poverty level among females between the ages 18 and 24 in the United States with a correlation coefficient (R) of -0.027 and weighted average of 29.0%, a difference of 29.0%.
Female Poverty Among 18-24 Year Olds Correlation Summary
| Measurement | Indonesian | Colville |
| Minimum | 4.1% | 4.9% |
| Maximum | 43.2% | 100.0% |
| Range | 39.1% | 95.1% |
| Mean | 23.5% | 42.2% |
| Median | 23.4% | 35.6% |
| Interquartile 25% (IQ1) | 18.2% | 24.1% |
| Interquartile 75% (IQ3) | 27.8% | 53.6% |
| Interquartile Range (IQR) | 9.6% | 29.6% |
| Standard Deviation (Sample) | 8.2% | 27.1% |
| Standard Deviation (Population) | 8.1% | 26.6% |
Similar Demographics by Female Poverty Among 18-24 Year Olds
Demographics Similar to Indonesians by Female Poverty Among 18-24 Year Olds
In terms of female poverty among 18-24 year olds, the demographic groups most similar to Indonesians are U.S. Virgin Islander (22.5%, a difference of 0.030%), Alaskan Athabascan (22.5%, a difference of 0.070%), Bangladeshi (22.5%, a difference of 0.12%), Shoshone (22.5%, a difference of 0.12%), and Menominee (22.5%, a difference of 0.23%).
| Demographics | Rating | Rank | Female Poverty Among 18-24 Year Olds |
| Immigrants | Middle Africa | 0.0 /100 | #287 | Tragic 22.1% |
| Dominicans | 0.0 /100 | #288 | Tragic 22.3% |
| French American Indians | 0.0 /100 | #289 | Tragic 22.3% |
| Immigrants | Senegal | 0.0 /100 | #290 | Tragic 22.4% |
| Bangladeshis | 0.0 /100 | #291 | Tragic 22.5% |
| Alaskan Athabascans | 0.0 /100 | #292 | Tragic 22.5% |
| U.S. Virgin Islanders | 0.0 /100 | #293 | Tragic 22.5% |
| Indonesians | 0.0 /100 | #294 | Tragic 22.5% |
| Shoshone | 0.0 /100 | #295 | Tragic 22.5% |
| Menominee | 0.0 /100 | #296 | Tragic 22.5% |
| Inupiat | 0.0 /100 | #297 | Tragic 22.6% |
| Central American Indians | 0.0 /100 | #298 | Tragic 22.6% |
| Cherokee | 0.0 /100 | #299 | Tragic 22.7% |
| Africans | 0.0 /100 | #300 | Tragic 22.8% |
| Seminole | 0.0 /100 | #301 | Tragic 22.9% |
Demographics Similar to Colville by Female Poverty Among 18-24 Year Olds
In terms of female poverty among 18-24 year olds, the demographic groups most similar to Colville are Kiowa (29.2%, a difference of 0.74%), Sioux (28.6%, a difference of 1.6%), Pima (28.4%, a difference of 2.1%), Puerto Rican (29.8%, a difference of 2.8%), and Hopi (28.2%, a difference of 2.9%).
| Demographics | Rating | Rank | Female Poverty Among 18-24 Year Olds |
| Apache | 0.0 /100 | #333 | Tragic 26.3% |
| Pueblo | 0.0 /100 | #334 | Tragic 26.9% |
| Yup'ik | 0.0 /100 | #335 | Tragic 27.0% |
| Immigrants | Yemen | 0.0 /100 | #336 | Tragic 27.5% |
| Cheyenne | 0.0 /100 | #337 | Tragic 28.1% |
| Hopi | 0.0 /100 | #338 | Tragic 28.2% |
| Pima | 0.0 /100 | #339 | Tragic 28.4% |
| Sioux | 0.0 /100 | #340 | Tragic 28.6% |
| Colville | 0.0 /100 | #341 | Tragic 29.0% |
| Kiowa | 0.0 /100 | #342 | Tragic 29.2% |
| Puerto Ricans | 0.0 /100 | #343 | Tragic 29.8% |
| Navajo | 0.0 /100 | #344 | Tragic 30.3% |
| Tohono O'odham | 0.0 /100 | #345 | Tragic 31.0% |
| Lumbee | 0.0 /100 | #346 | Tragic 31.1% |
| Crow | 0.0 /100 | #347 | Tragic 33.2% |