Immigrants from Zaire vs Yakama Median Female Earnings
COMPARE
Immigrants from Zaire
Yakama
Median Female Earnings
Median Female Earnings Comparison
Immigrants from Zaire
Yakama
$36,017
MEDIAN FEMALE EARNINGS
0.0/ 100
METRIC RATING
288th/ 347
METRIC RANK
$33,354
MEDIAN FEMALE EARNINGS
0.0/ 100
METRIC RATING
337th/ 347
METRIC RANK
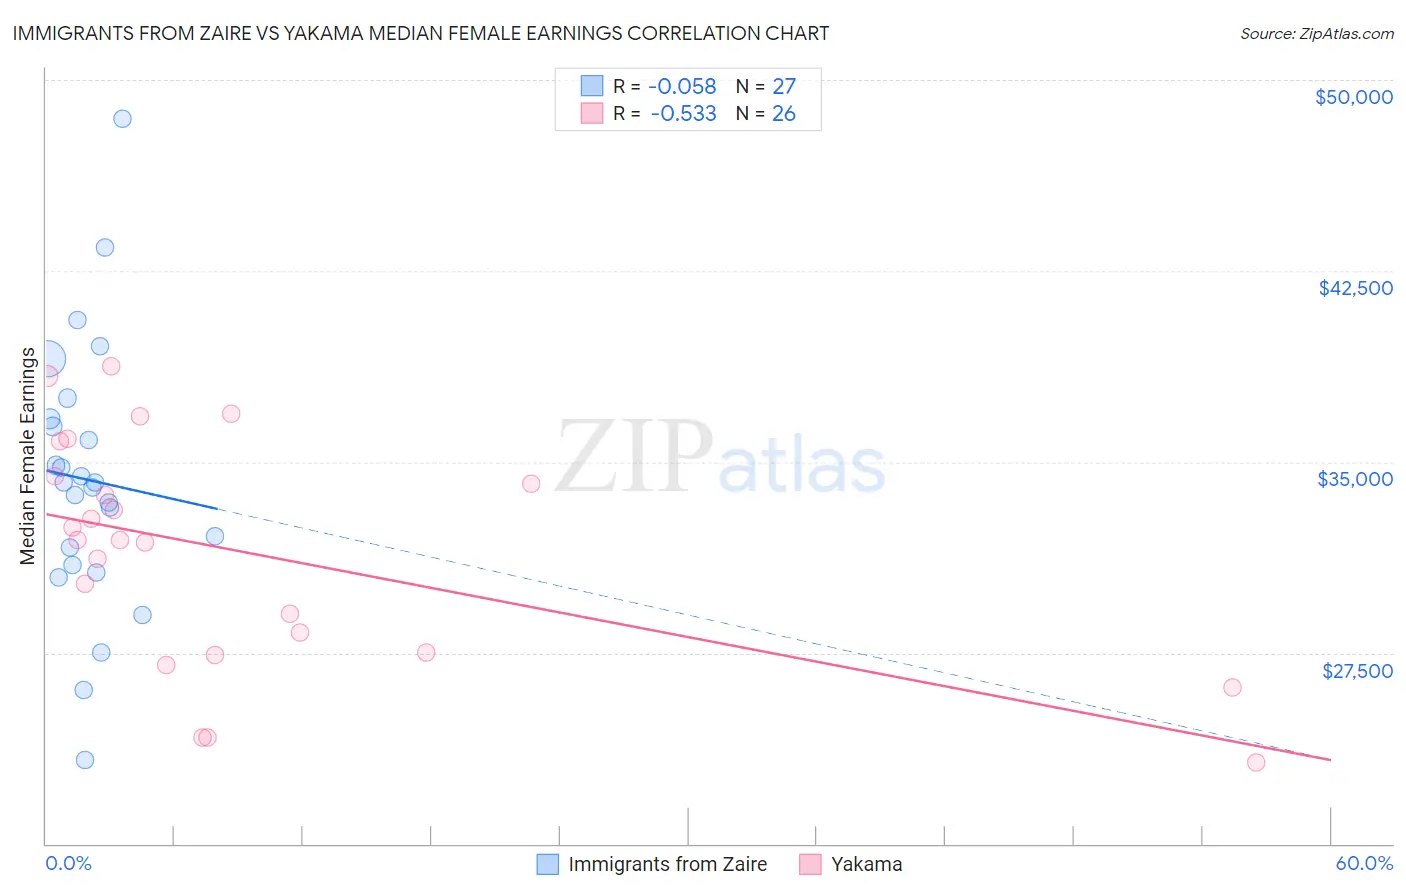
Immigrants from Zaire vs Yakama Median Female Earnings Correlation Chart
The statistical analysis conducted on geographies consisting of 107,241,232 people shows a slight negative correlation between the proportion of Immigrants from Zaire and median female earnings in the United States with a correlation coefficient (R) of -0.058 and weighted average of $36,017. Similarly, the statistical analysis conducted on geographies consisting of 19,910,730 people shows a substantial negative correlation between the proportion of Yakama and median female earnings in the United States with a correlation coefficient (R) of -0.533 and weighted average of $33,354, a difference of 8.0%.
Median Female Earnings Correlation Summary
| Measurement | Immigrants from Zaire | Yakama |
| Minimum | $23,286 | $23,214 |
| Maximum | $48,487 | $38,750 |
| Range | $25,201 | $15,536 |
| Mean | $34,296 | $31,429 |
| Median | $34,189 | $31,931 |
| Interquartile 25% (IQ1) | $30,969 | $27,516 |
| Interquartile 75% (IQ3) | $36,705 | $34,456 |
| Interquartile Range (IQR) | $5,736 | $6,940 |
| Standard Deviation (Sample) | $5,243 | $4,456 |
| Standard Deviation (Population) | $5,145 | $4,370 |
Similar Demographics by Median Female Earnings
Demographics Similar to Immigrants from Zaire by Median Female Earnings
In terms of median female earnings, the demographic groups most similar to Immigrants from Zaire are Immigrants from Nicaragua ($36,023, a difference of 0.020%), Osage ($36,034, a difference of 0.050%), Paiute ($36,056, a difference of 0.11%), Bangladeshi ($35,960, a difference of 0.16%), and Central American Indian ($35,930, a difference of 0.24%).
| Demographics | Rating | Rank | Median Female Earnings |
| Spanish Americans | 0.1 /100 | #281 | Tragic $36,391 |
| Haitians | 0.1 /100 | #282 | Tragic $36,374 |
| Immigrants | Haiti | 0.1 /100 | #283 | Tragic $36,203 |
| Indonesians | 0.1 /100 | #284 | Tragic $36,140 |
| Paiute | 0.1 /100 | #285 | Tragic $36,056 |
| Osage | 0.0 /100 | #286 | Tragic $36,034 |
| Immigrants | Nicaragua | 0.0 /100 | #287 | Tragic $36,023 |
| Immigrants | Zaire | 0.0 /100 | #288 | Tragic $36,017 |
| Bangladeshis | 0.0 /100 | #289 | Tragic $35,960 |
| Central American Indians | 0.0 /100 | #290 | Tragic $35,930 |
| Blackfeet | 0.0 /100 | #291 | Tragic $35,864 |
| Americans | 0.0 /100 | #292 | Tragic $35,777 |
| Guatemalans | 0.0 /100 | #293 | Tragic $35,695 |
| Cheyenne | 0.0 /100 | #294 | Tragic $35,673 |
| Comanche | 0.0 /100 | #295 | Tragic $35,661 |
Demographics Similar to Yakama by Median Female Earnings
In terms of median female earnings, the demographic groups most similar to Yakama are Ottawa ($33,378, a difference of 0.070%), Immigrants from Cuba ($33,291, a difference of 0.19%), Creek ($33,437, a difference of 0.25%), Immigrants from Mexico ($33,236, a difference of 0.36%), and Tohono O'odham ($33,205, a difference of 0.45%).
| Demographics | Rating | Rank | Median Female Earnings |
| Menominee | 0.0 /100 | #330 | Tragic $33,894 |
| Natives/Alaskans | 0.0 /100 | #331 | Tragic $33,806 |
| Choctaw | 0.0 /100 | #332 | Tragic $33,775 |
| Mexicans | 0.0 /100 | #333 | Tragic $33,664 |
| Spanish American Indians | 0.0 /100 | #334 | Tragic $33,625 |
| Creek | 0.0 /100 | #335 | Tragic $33,437 |
| Ottawa | 0.0 /100 | #336 | Tragic $33,378 |
| Yakama | 0.0 /100 | #337 | Tragic $33,354 |
| Immigrants | Cuba | 0.0 /100 | #338 | Tragic $33,291 |
| Immigrants | Mexico | 0.0 /100 | #339 | Tragic $33,236 |
| Tohono O'odham | 0.0 /100 | #340 | Tragic $33,205 |
| Navajo | 0.0 /100 | #341 | Tragic $33,046 |
| Yup'ik | 0.0 /100 | #342 | Tragic $32,730 |
| Pueblo | 0.0 /100 | #343 | Tragic $32,564 |
| Lumbee | 0.0 /100 | #344 | Tragic $32,500 |