Immigrants from Zaire vs Egyptian Professional Degree
COMPARE
Immigrants from Zaire
Egyptian
Professional Degree
Professional Degree Comparison
Immigrants from Zaire
Egyptians
4.5%
PROFESSIONAL DEGREE
57.4/ 100
METRIC RATING
170th/ 347
METRIC RANK
5.3%
PROFESSIONAL DEGREE
99.5/ 100
METRIC RATING
88th/ 347
METRIC RANK
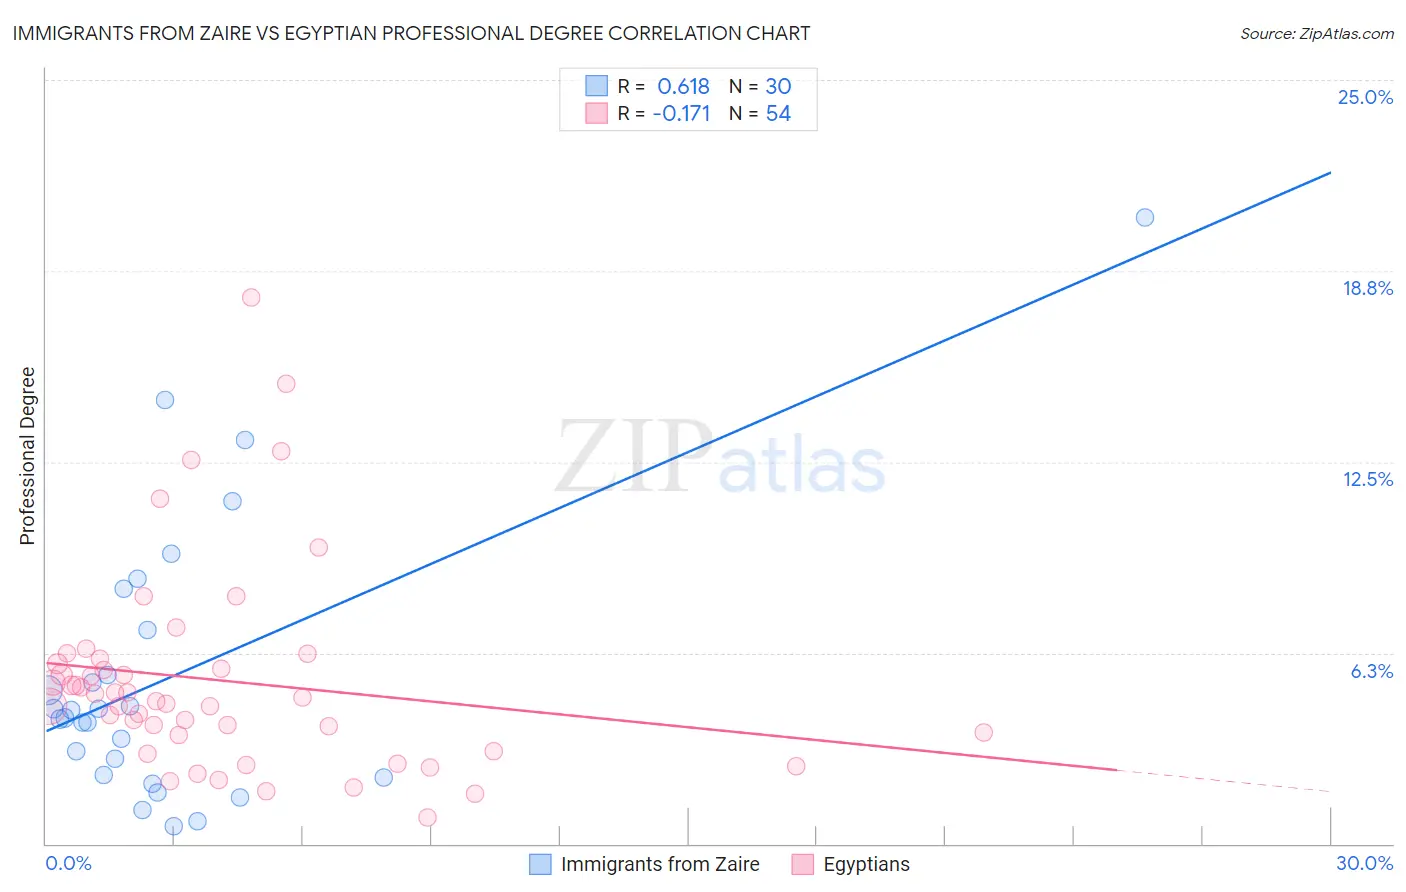
Immigrants from Zaire vs Egyptian Professional Degree Correlation Chart
The statistical analysis conducted on geographies consisting of 107,228,641 people shows a significant positive correlation between the proportion of Immigrants from Zaire and percentage of population with at least professional degree education in the United States with a correlation coefficient (R) of 0.618 and weighted average of 4.5%. Similarly, the statistical analysis conducted on geographies consisting of 276,647,843 people shows a poor negative correlation between the proportion of Egyptians and percentage of population with at least professional degree education in the United States with a correlation coefficient (R) of -0.171 and weighted average of 5.3%, a difference of 18.0%.
Professional Degree Correlation Summary
| Measurement | Immigrants from Zaire | Egyptian |
| Minimum | 0.59% | 0.86% |
| Maximum | 20.5% | 17.9% |
| Range | 19.9% | 17.0% |
| Mean | 5.5% | 5.3% |
| Median | 4.2% | 4.7% |
| Interquartile 25% (IQ1) | 2.3% | 3.6% |
| Interquartile 75% (IQ3) | 7.0% | 5.9% |
| Interquartile Range (IQR) | 4.7% | 2.3% |
| Standard Deviation (Sample) | 4.5% | 3.3% |
| Standard Deviation (Population) | 4.5% | 3.3% |
Similar Demographics by Professional Degree
Demographics Similar to Immigrants from Zaire by Professional Degree
In terms of professional degree, the demographic groups most similar to Immigrants from Zaire are Chinese (4.5%, a difference of 0.18%), Immigrants from Sierra Leone (4.5%, a difference of 0.19%), Immigrants from Bangladesh (4.4%, a difference of 0.22%), Immigrants from Afghanistan (4.5%, a difference of 0.26%), and Immigrants from Colombia (4.5%, a difference of 0.29%).
| Demographics | Rating | Rank | Professional Degree |
| Sierra Leoneans | 64.3 /100 | #163 | Good 4.5% |
| Swiss | 61.0 /100 | #164 | Good 4.5% |
| Costa Ricans | 59.9 /100 | #165 | Average 4.5% |
| Immigrants | Colombia | 59.4 /100 | #166 | Average 4.5% |
| Immigrants | Afghanistan | 59.2 /100 | #167 | Average 4.5% |
| Immigrants | Sierra Leone | 58.7 /100 | #168 | Average 4.5% |
| Chinese | 58.6 /100 | #169 | Average 4.5% |
| Immigrants | Zaire | 57.4 /100 | #170 | Average 4.5% |
| Immigrants | Bangladesh | 56.0 /100 | #171 | Average 4.4% |
| Spaniards | 52.0 /100 | #172 | Average 4.4% |
| English | 50.1 /100 | #173 | Average 4.4% |
| Kenyans | 50.0 /100 | #174 | Average 4.4% |
| Irish | 50.0 /100 | #175 | Average 4.4% |
| Immigrants | Peru | 49.3 /100 | #176 | Average 4.4% |
| Celtics | 47.6 /100 | #177 | Average 4.4% |
Demographics Similar to Egyptians by Professional Degree
In terms of professional degree, the demographic groups most similar to Egyptians are Chilean (5.3%, a difference of 0.0%), Immigrants from Scotland (5.3%, a difference of 0.10%), Immigrants from Chile (5.3%, a difference of 0.14%), Immigrants from Zimbabwe (5.3%, a difference of 0.25%), and Greek (5.3%, a difference of 0.25%).
| Demographics | Rating | Rank | Professional Degree |
| Immigrants | Brazil | 99.6 /100 | #81 | Exceptional 5.3% |
| Romanians | 99.6 /100 | #82 | Exceptional 5.3% |
| Carpatho Rusyns | 99.6 /100 | #83 | Exceptional 5.3% |
| Immigrants | Croatia | 99.6 /100 | #84 | Exceptional 5.3% |
| Immigrants | Zimbabwe | 99.6 /100 | #85 | Exceptional 5.3% |
| Greeks | 99.6 /100 | #86 | Exceptional 5.3% |
| Immigrants | Chile | 99.5 /100 | #87 | Exceptional 5.3% |
| Egyptians | 99.5 /100 | #88 | Exceptional 5.3% |
| Chileans | 99.5 /100 | #89 | Exceptional 5.3% |
| Immigrants | Scotland | 99.5 /100 | #90 | Exceptional 5.3% |
| Laotians | 99.5 /100 | #91 | Exceptional 5.2% |
| Immigrants | Eastern Europe | 99.5 /100 | #92 | Exceptional 5.2% |
| Northern Europeans | 99.3 /100 | #93 | Exceptional 5.2% |
| Alsatians | 99.3 /100 | #94 | Exceptional 5.2% |
| Zimbabweans | 99.3 /100 | #95 | Exceptional 5.2% |