Immigrants from Honduras vs Immigrants from Kuwait 3 or more Vehicles in Household
COMPARE
Immigrants from Honduras
Immigrants from Kuwait
3 or more Vehicles in Household
3 or more Vehicles in Household Comparison
Immigrants from Honduras
Immigrants from Kuwait
18.2%
3 OR MORE VEHICLES IN HOUSEHOLD
3.1/ 100
METRIC RATING
238th/ 347
METRIC RANK
19.1%
3 OR MORE VEHICLES IN HOUSEHOLD
26.1/ 100
METRIC RATING
188th/ 347
METRIC RANK
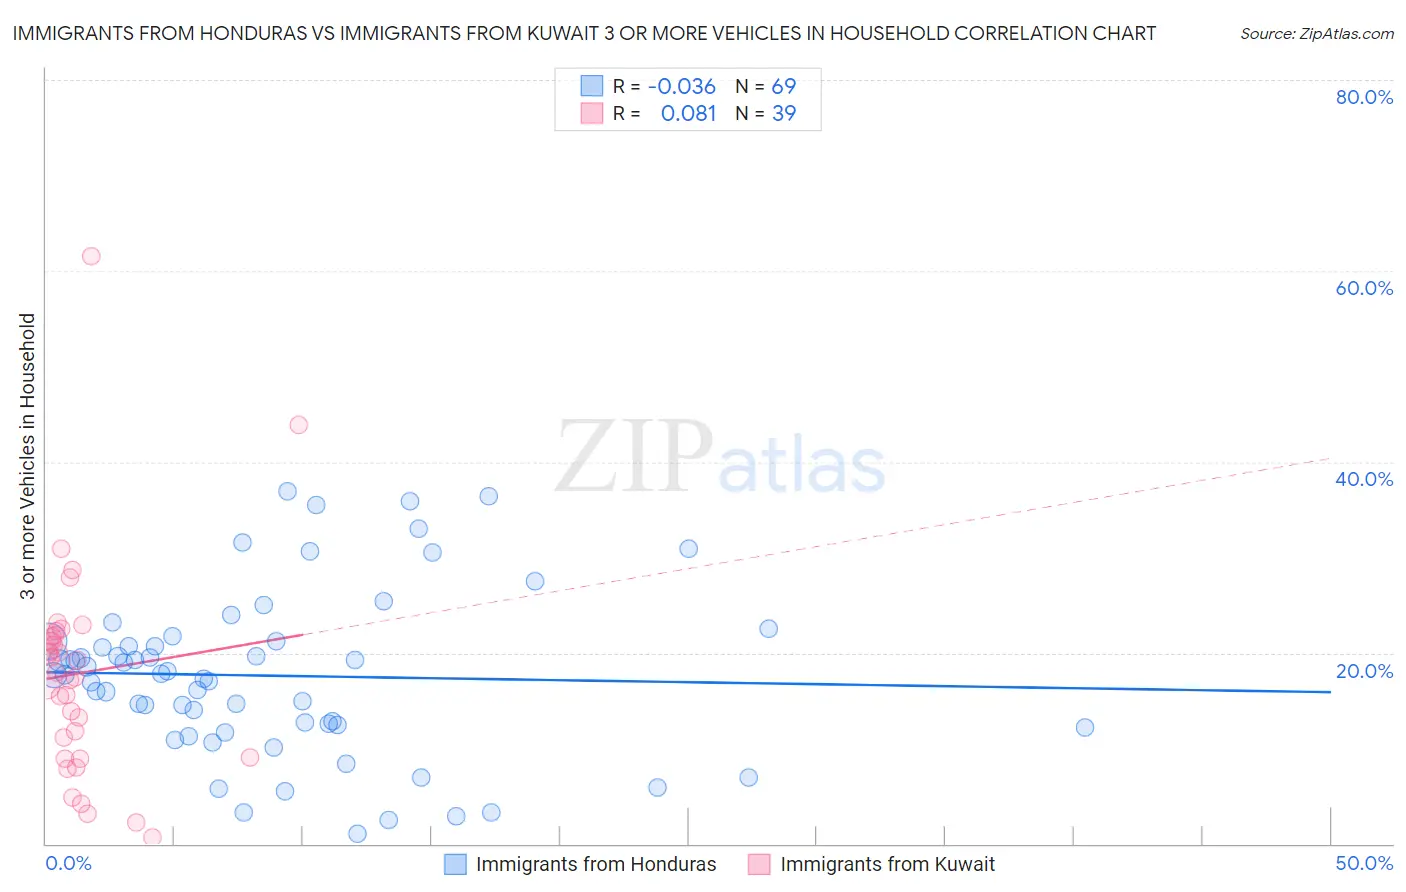
Immigrants from Honduras vs Immigrants from Kuwait 3 or more Vehicles in Household Correlation Chart
The statistical analysis conducted on geographies consisting of 322,444,199 people shows no correlation between the proportion of Immigrants from Honduras and percentage of households with 3 or more vehicles available in the United States with a correlation coefficient (R) of -0.036 and weighted average of 18.2%. Similarly, the statistical analysis conducted on geographies consisting of 136,861,731 people shows a slight positive correlation between the proportion of Immigrants from Kuwait and percentage of households with 3 or more vehicles available in the United States with a correlation coefficient (R) of 0.081 and weighted average of 19.1%, a difference of 4.8%.
3 or more Vehicles in Household Correlation Summary
| Measurement | Immigrants from Honduras | Immigrants from Kuwait |
| Minimum | 1.0% | 0.71% |
| Maximum | 36.9% | 61.6% |
| Range | 35.9% | 60.9% |
| Mean | 17.6% | 17.9% |
| Median | 17.7% | 17.9% |
| Interquartile 25% (IQ1) | 12.3% | 9.1% |
| Interquartile 75% (IQ3) | 21.2% | 21.8% |
| Interquartile Range (IQR) | 8.9% | 12.7% |
| Standard Deviation (Sample) | 8.6% | 11.3% |
| Standard Deviation (Population) | 8.5% | 11.1% |
Similar Demographics by 3 or more Vehicles in Household
Demographics Similar to Immigrants from Honduras by 3 or more Vehicles in Household
In terms of 3 or more vehicles in household, the demographic groups most similar to Immigrants from Honduras are Immigrants from Middle Africa (18.2%, a difference of 0.010%), Immigrants from China (18.2%, a difference of 0.13%), Indonesian (18.3%, a difference of 0.23%), Immigrants from Malaysia (18.3%, a difference of 0.28%), and African (18.2%, a difference of 0.33%).
| Demographics | Rating | Rank | 3 or more Vehicles in Household |
| Immigrants | Belgium | 4.8 /100 | #231 | Tragic 18.4% |
| Immigrants | Uganda | 4.6 /100 | #232 | Tragic 18.4% |
| Hondurans | 4.6 /100 | #233 | Tragic 18.4% |
| Immigrants | North Macedonia | 4.4 /100 | #234 | Tragic 18.4% |
| Sierra Leoneans | 3.9 /100 | #235 | Tragic 18.3% |
| Immigrants | Malaysia | 3.6 /100 | #236 | Tragic 18.3% |
| Indonesians | 3.5 /100 | #237 | Tragic 18.3% |
| Immigrants | Honduras | 3.1 /100 | #238 | Tragic 18.2% |
| Immigrants | Middle Africa | 3.1 /100 | #239 | Tragic 18.2% |
| Immigrants | China | 2.9 /100 | #240 | Tragic 18.2% |
| Africans | 2.7 /100 | #241 | Tragic 18.2% |
| Hopi | 2.5 /100 | #242 | Tragic 18.2% |
| Immigrants | Europe | 2.4 /100 | #243 | Tragic 18.1% |
| Mongolians | 2.3 /100 | #244 | Tragic 18.1% |
| Immigrants | Belize | 2.1 /100 | #245 | Tragic 18.1% |
Demographics Similar to Immigrants from Kuwait by 3 or more Vehicles in Household
In terms of 3 or more vehicles in household, the demographic groups most similar to Immigrants from Kuwait are Indian (Asian) (19.1%, a difference of 0.010%), Immigrants from Zimbabwe (19.1%, a difference of 0.060%), South American Indian (19.1%, a difference of 0.070%), Kenyan (19.1%, a difference of 0.14%), and Tsimshian (19.1%, a difference of 0.17%).
| Demographics | Rating | Rank | 3 or more Vehicles in Household |
| Romanians | 37.1 /100 | #181 | Fair 19.3% |
| Cubans | 36.6 /100 | #182 | Fair 19.3% |
| Cajuns | 36.0 /100 | #183 | Fair 19.3% |
| Latvians | 35.7 /100 | #184 | Fair 19.3% |
| Immigrants | Sri Lanka | 30.7 /100 | #185 | Fair 19.2% |
| Immigrants | Sweden | 29.0 /100 | #186 | Fair 19.2% |
| Immigrants | Hong Kong | 28.3 /100 | #187 | Fair 19.2% |
| Immigrants | Kuwait | 26.1 /100 | #188 | Fair 19.1% |
| Indians (Asian) | 26.0 /100 | #189 | Fair 19.1% |
| Immigrants | Zimbabwe | 25.5 /100 | #190 | Fair 19.1% |
| South American Indians | 25.4 /100 | #191 | Fair 19.1% |
| Kenyans | 24.7 /100 | #192 | Fair 19.1% |
| Tsimshian | 24.4 /100 | #193 | Fair 19.1% |
| Serbians | 24.0 /100 | #194 | Fair 19.1% |
| Immigrants | Moldova | 23.6 /100 | #195 | Fair 19.1% |