Immigrants from Indonesia vs Hispanic or Latino 4 or more Vehicles in Household
COMPARE
Immigrants from Indonesia
Hispanic or Latino
4 or more Vehicles in Household
4 or more Vehicles in Household Comparison
Immigrants from Indonesia
Hispanics or Latinos
7.2%
4 OR MORE VEHICLES IN HOUSEHOLD
99.6/ 100
METRIC RATING
86th/ 347
METRIC RANK
7.6%
4 OR MORE VEHICLES IN HOUSEHOLD
100.0/ 100
METRIC RATING
59th/ 347
METRIC RANK
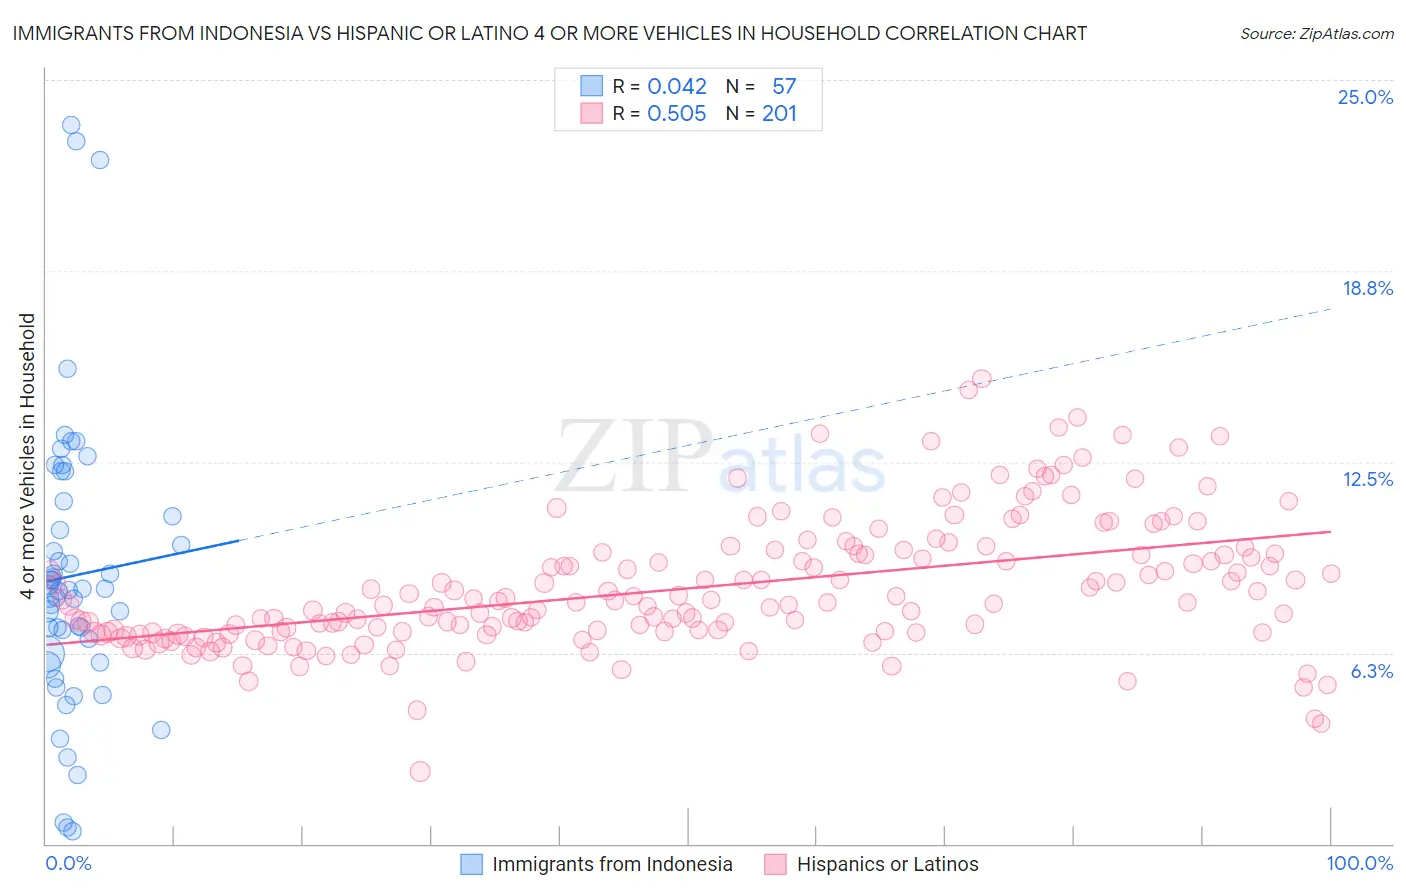
Immigrants from Indonesia vs Hispanic or Latino 4 or more Vehicles in Household Correlation Chart
The statistical analysis conducted on geographies consisting of 214,959,702 people shows no correlation between the proportion of Immigrants from Indonesia and percentage of households with 4 or more vehicles available in the United States with a correlation coefficient (R) of 0.042 and weighted average of 7.2%. Similarly, the statistical analysis conducted on geographies consisting of 574,511,520 people shows a substantial positive correlation between the proportion of Hispanics or Latinos and percentage of households with 4 or more vehicles available in the United States with a correlation coefficient (R) of 0.505 and weighted average of 7.6%, a difference of 5.3%.
4 or more Vehicles in Household Correlation Summary
| Measurement | Immigrants from Indonesia | Hispanic or Latino |
| Minimum | 0.42% | 2.4% |
| Maximum | 23.5% | 15.2% |
| Range | 23.1% | 12.9% |
| Mean | 8.8% | 8.4% |
| Median | 8.3% | 7.9% |
| Interquartile 25% (IQ1) | 6.1% | 6.9% |
| Interquartile 75% (IQ3) | 11.0% | 9.5% |
| Interquartile Range (IQR) | 4.9% | 2.6% |
| Standard Deviation (Sample) | 4.8% | 2.1% |
| Standard Deviation (Population) | 4.7% | 2.1% |
Similar Demographics by 4 or more Vehicles in Household
Demographics Similar to Immigrants from Indonesia by 4 or more Vehicles in Household
In terms of 4 or more vehicles in household, the demographic groups most similar to Immigrants from Indonesia are Delaware (7.2%, a difference of 0.060%), Nonimmigrants (7.2%, a difference of 0.080%), Cree (7.2%, a difference of 0.18%), Afghan (7.3%, a difference of 0.35%), and British (7.2%, a difference of 0.41%).
| Demographics | Rating | Rank | 4 or more Vehicles in Household |
| Czechs | 99.8 /100 | #79 | Exceptional 7.4% |
| Alaska Natives | 99.8 /100 | #80 | Exceptional 7.3% |
| Finns | 99.8 /100 | #81 | Exceptional 7.3% |
| Northern Europeans | 99.8 /100 | #82 | Exceptional 7.3% |
| Potawatomi | 99.7 /100 | #83 | Exceptional 7.3% |
| Afghans | 99.7 /100 | #84 | Exceptional 7.3% |
| Cree | 99.7 /100 | #85 | Exceptional 7.2% |
| Immigrants | Indonesia | 99.6 /100 | #86 | Exceptional 7.2% |
| Delaware | 99.6 /100 | #87 | Exceptional 7.2% |
| Immigrants | Nonimmigrants | 99.6 /100 | #88 | Exceptional 7.2% |
| British | 99.6 /100 | #89 | Exceptional 7.2% |
| Creek | 99.6 /100 | #90 | Exceptional 7.2% |
| Assyrians/Chaldeans/Syriacs | 99.4 /100 | #91 | Exceptional 7.2% |
| Immigrants | Latin America | 99.4 /100 | #92 | Exceptional 7.1% |
| Immigrants | Afghanistan | 99.3 /100 | #93 | Exceptional 7.1% |
Demographics Similar to Hispanics or Latinos by 4 or more Vehicles in Household
In terms of 4 or more vehicles in household, the demographic groups most similar to Hispanics or Latinos are Pennsylvania German (7.6%, a difference of 0.040%), Swedish (7.6%, a difference of 0.040%), Spaniard (7.6%, a difference of 0.060%), English (7.6%, a difference of 0.16%), and Immigrants from Oceania (7.6%, a difference of 0.17%).
| Demographics | Rating | Rank | 4 or more Vehicles in Household |
| Japanese | 100.0 /100 | #52 | Exceptional 7.7% |
| Malaysians | 100.0 /100 | #53 | Exceptional 7.7% |
| Dutch | 100.0 /100 | #54 | Exceptional 7.7% |
| Immigrants | Oceania | 100.0 /100 | #55 | Exceptional 7.6% |
| English | 100.0 /100 | #56 | Exceptional 7.6% |
| Pennsylvania Germans | 100.0 /100 | #57 | Exceptional 7.6% |
| Swedes | 100.0 /100 | #58 | Exceptional 7.6% |
| Hispanics or Latinos | 100.0 /100 | #59 | Exceptional 7.6% |
| Spaniards | 100.0 /100 | #60 | Exceptional 7.6% |
| Europeans | 100.0 /100 | #61 | Exceptional 7.6% |
| Chippewa | 100.0 /100 | #62 | Exceptional 7.6% |
| Immigrants | Micronesia | 100.0 /100 | #63 | Exceptional 7.6% |
| Bangladeshis | 100.0 /100 | #64 | Exceptional 7.6% |
| Immigrants | Azores | 100.0 /100 | #65 | Exceptional 7.5% |
| Immigrants | Taiwan | 99.9 /100 | #66 | Exceptional 7.5% |