Immigrants from Uruguay vs Sioux 3 or more Vehicles in Household
COMPARE
Immigrants from Uruguay
Sioux
3 or more Vehicles in Household
3 or more Vehicles in Household Comparison
Immigrants from Uruguay
Sioux
17.1%
3 OR MORE VEHICLES IN HOUSEHOLD
0.2/ 100
METRIC RATING
288th/ 347
METRIC RANK
22.6%
3 OR MORE VEHICLES IN HOUSEHOLD
100.0/ 100
METRIC RATING
50th/ 347
METRIC RANK
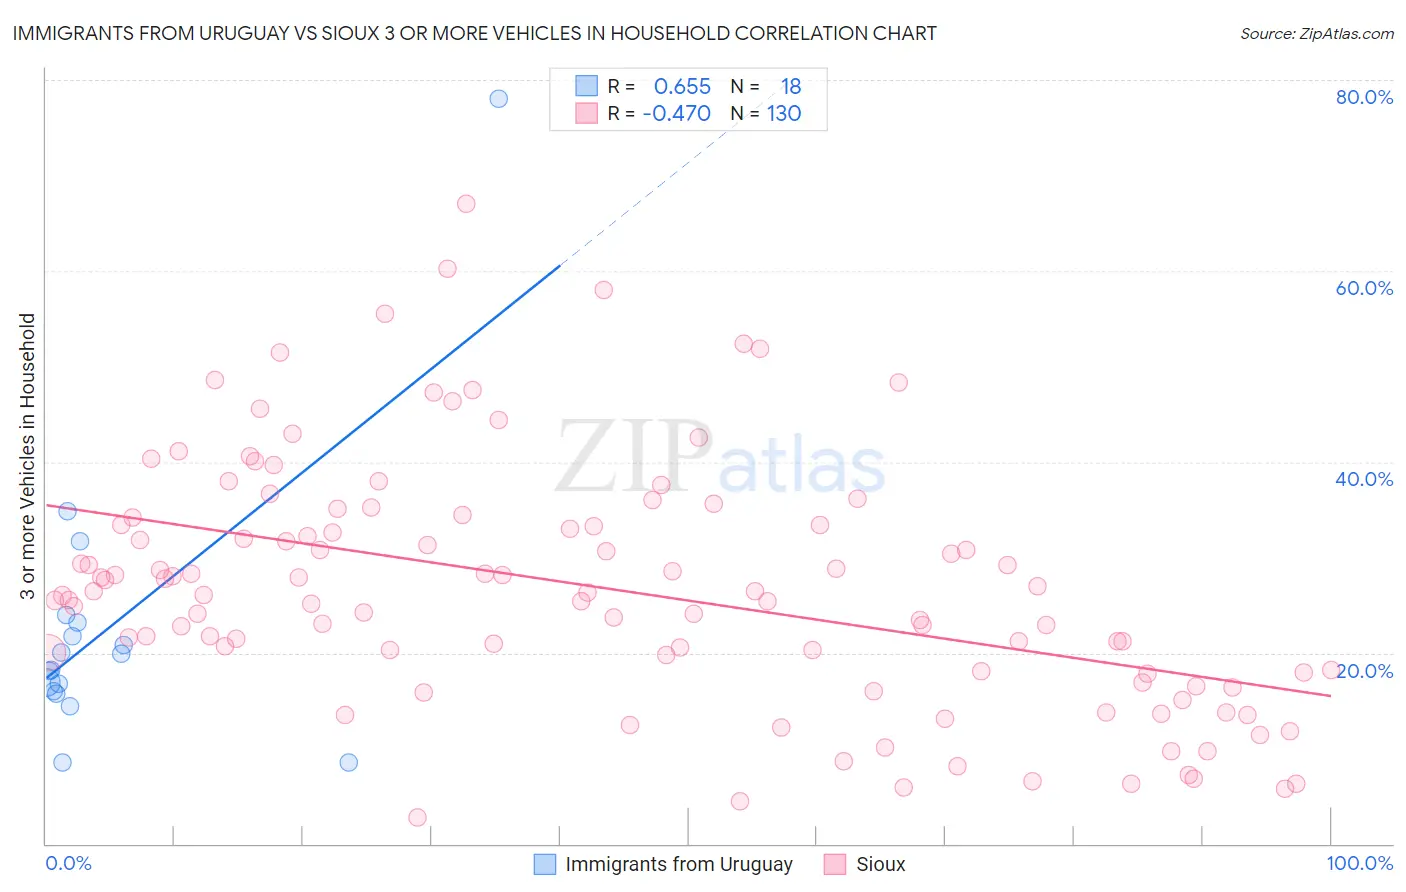
Immigrants from Uruguay vs Sioux 3 or more Vehicles in Household Correlation Chart
The statistical analysis conducted on geographies consisting of 133,238,313 people shows a significant positive correlation between the proportion of Immigrants from Uruguay and percentage of households with 3 or more vehicles available in the United States with a correlation coefficient (R) of 0.655 and weighted average of 17.1%. Similarly, the statistical analysis conducted on geographies consisting of 234,089,228 people shows a moderate negative correlation between the proportion of Sioux and percentage of households with 3 or more vehicles available in the United States with a correlation coefficient (R) of -0.470 and weighted average of 22.6%, a difference of 32.0%.
3 or more Vehicles in Household Correlation Summary
| Measurement | Immigrants from Uruguay | Sioux |
| Minimum | 8.6% | 2.8% |
| Maximum | 78.0% | 67.1% |
| Range | 69.5% | 64.3% |
| Mean | 22.6% | 26.9% |
| Median | 19.0% | 26.2% |
| Interquartile 25% (IQ1) | 16.0% | 18.1% |
| Interquartile 75% (IQ3) | 23.1% | 33.5% |
| Interquartile Range (IQR) | 7.1% | 15.3% |
| Standard Deviation (Sample) | 15.3% | 12.8% |
| Standard Deviation (Population) | 14.9% | 12.8% |
Similar Demographics by 3 or more Vehicles in Household
Demographics Similar to Immigrants from Uruguay by 3 or more Vehicles in Household
In terms of 3 or more vehicles in household, the demographic groups most similar to Immigrants from Uruguay are Immigrants from Liberia (17.1%, a difference of 0.070%), Immigrants from Brazil (17.1%, a difference of 0.090%), Menominee (17.2%, a difference of 0.39%), Immigrants from Croatia (17.2%, a difference of 0.45%), and Liberian (17.0%, a difference of 0.64%).
| Demographics | Rating | Rank | 3 or more Vehicles in Household |
| Immigrants | Latvia | 0.3 /100 | #281 | Tragic 17.4% |
| Immigrants | Ireland | 0.3 /100 | #282 | Tragic 17.3% |
| Blacks/African Americans | 0.3 /100 | #283 | Tragic 17.3% |
| Immigrants | Colombia | 0.3 /100 | #284 | Tragic 17.3% |
| Immigrants | Croatia | 0.2 /100 | #285 | Tragic 17.2% |
| Menominee | 0.2 /100 | #286 | Tragic 17.2% |
| Immigrants | Brazil | 0.2 /100 | #287 | Tragic 17.1% |
| Immigrants | Uruguay | 0.2 /100 | #288 | Tragic 17.1% |
| Immigrants | Liberia | 0.1 /100 | #289 | Tragic 17.1% |
| Liberians | 0.1 /100 | #290 | Tragic 17.0% |
| Immigrants | Congo | 0.1 /100 | #291 | Tragic 17.0% |
| Immigrants | Spain | 0.1 /100 | #292 | Tragic 17.0% |
| Bahamians | 0.1 /100 | #293 | Tragic 16.9% |
| Immigrants | Western Africa | 0.1 /100 | #294 | Tragic 16.9% |
| Immigrants | Russia | 0.1 /100 | #295 | Tragic 16.9% |
Demographics Similar to Sioux by 3 or more Vehicles in Household
In terms of 3 or more vehicles in household, the demographic groups most similar to Sioux are White/Caucasian (22.6%, a difference of 0.010%), Welsh (22.6%, a difference of 0.050%), Scotch-Irish (22.6%, a difference of 0.060%), Scottish (22.6%, a difference of 0.16%), and Malaysian (22.6%, a difference of 0.17%).
| Demographics | Rating | Rank | 3 or more Vehicles in Household |
| Osage | 100.0 /100 | #43 | Exceptional 22.7% |
| Cheyenne | 100.0 /100 | #44 | Exceptional 22.7% |
| Ute | 100.0 /100 | #45 | Exceptional 22.7% |
| Americans | 100.0 /100 | #46 | Exceptional 22.6% |
| Malaysians | 100.0 /100 | #47 | Exceptional 22.6% |
| Scottish | 100.0 /100 | #48 | Exceptional 22.6% |
| Scotch-Irish | 100.0 /100 | #49 | Exceptional 22.6% |
| Sioux | 100.0 /100 | #50 | Exceptional 22.6% |
| Whites/Caucasians | 100.0 /100 | #51 | Exceptional 22.6% |
| Welsh | 100.0 /100 | #52 | Exceptional 22.6% |
| Czechs | 100.0 /100 | #53 | Exceptional 22.5% |
| Crow | 100.0 /100 | #54 | Exceptional 22.5% |
| Immigrants | Laos | 100.0 /100 | #55 | Exceptional 22.4% |
| Hispanics or Latinos | 100.0 /100 | #56 | Exceptional 22.4% |
| Pennsylvania Germans | 100.0 /100 | #57 | Exceptional 22.3% |