Immigrants from Trinidad and Tobago vs Immigrants from Saudi Arabia Householder Income Ages 25 - 44 years
COMPARE
Immigrants from Trinidad and Tobago
Immigrants from Saudi Arabia
Householder Income Ages 25 - 44 years
Householder Income Ages 25 - 44 years Comparison
Immigrants from Trinidad and Tobago
Immigrants from Saudi Arabia
$89,748
HOUSEHOLDER INCOME AGES 25 - 44 YEARS
6.5/ 100
METRIC RATING
221st/ 347
METRIC RANK
$95,450
HOUSEHOLDER INCOME AGES 25 - 44 YEARS
62.0/ 100
METRIC RATING
163rd/ 347
METRIC RANK
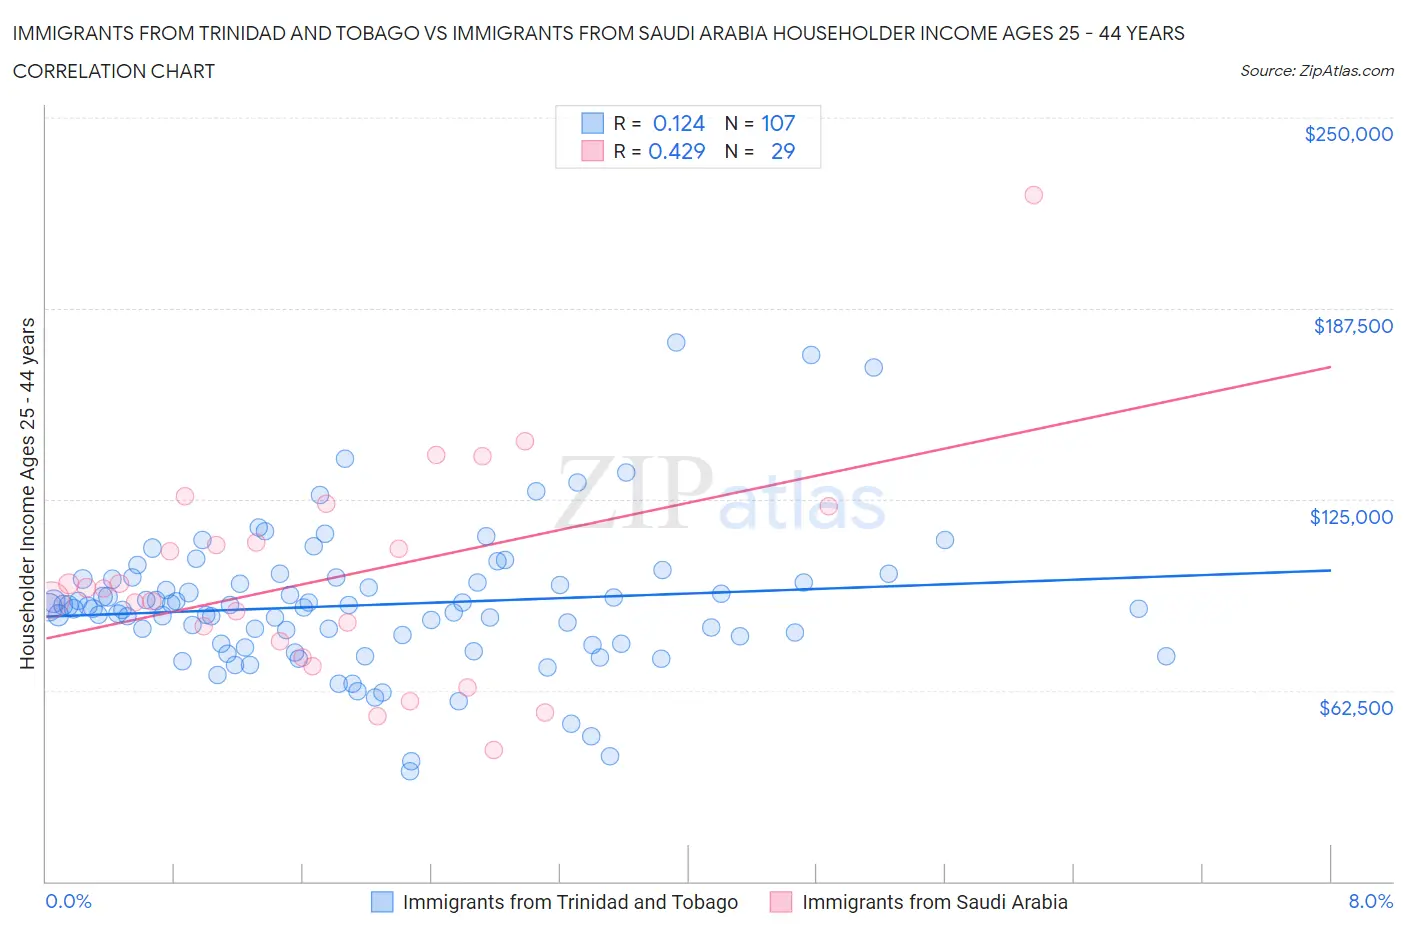
Immigrants from Trinidad and Tobago vs Immigrants from Saudi Arabia Householder Income Ages 25 - 44 years Correlation Chart
The statistical analysis conducted on geographies consisting of 223,299,534 people shows a poor positive correlation between the proportion of Immigrants from Trinidad and Tobago and household income with householder between the ages 25 and 44 in the United States with a correlation coefficient (R) of 0.124 and weighted average of $89,748. Similarly, the statistical analysis conducted on geographies consisting of 164,160,916 people shows a moderate positive correlation between the proportion of Immigrants from Saudi Arabia and household income with householder between the ages 25 and 44 in the United States with a correlation coefficient (R) of 0.429 and weighted average of $95,450, a difference of 6.4%.
Householder Income Ages 25 - 44 years Correlation Summary
| Measurement | Immigrants from Trinidad and Tobago | Immigrants from Saudi Arabia |
| Minimum | $35,919 | $42,908 |
| Maximum | $176,250 | $224,728 |
| Range | $140,331 | $181,820 |
| Mean | $90,423 | $99,059 |
| Median | $89,618 | $95,793 |
| Interquartile 25% (IQ1) | $77,590 | $75,904 |
| Interquartile 75% (IQ3) | $98,814 | $116,882 |
| Interquartile Range (IQR) | $21,224 | $40,978 |
| Standard Deviation (Sample) | $23,047 | $35,873 |
| Standard Deviation (Population) | $22,939 | $35,249 |
Similar Demographics by Householder Income Ages 25 - 44 years
Demographics Similar to Immigrants from Trinidad and Tobago by Householder Income Ages 25 - 44 years
In terms of householder income ages 25 - 44 years, the demographic groups most similar to Immigrants from Trinidad and Tobago are Immigrants from Ecuador ($89,673, a difference of 0.080%), Trinidadian and Tobagonian ($89,856, a difference of 0.12%), Delaware ($89,876, a difference of 0.14%), Immigrants from Guyana ($89,586, a difference of 0.18%), and Barbadian ($89,565, a difference of 0.20%).
| Demographics | Rating | Rank | Householder Income Ages 25 - 44 years |
| Immigrants | Africa | 8.9 /100 | #214 | Tragic $90,372 |
| Panamanians | 8.1 /100 | #215 | Tragic $90,193 |
| Ghanaians | 7.9 /100 | #216 | Tragic $90,137 |
| Scotch-Irish | 7.3 /100 | #217 | Tragic $89,969 |
| Guyanese | 7.1 /100 | #218 | Tragic $89,940 |
| Delaware | 6.9 /100 | #219 | Tragic $89,876 |
| Trinidadians and Tobagonians | 6.8 /100 | #220 | Tragic $89,856 |
| Immigrants | Trinidad and Tobago | 6.5 /100 | #221 | Tragic $89,748 |
| Immigrants | Ecuador | 6.2 /100 | #222 | Tragic $89,673 |
| Immigrants | Guyana | 5.9 /100 | #223 | Tragic $89,586 |
| Barbadians | 5.9 /100 | #224 | Tragic $89,565 |
| Immigrants | Panama | 5.5 /100 | #225 | Tragic $89,451 |
| Immigrants | Iraq | 5.5 /100 | #226 | Tragic $89,444 |
| Immigrants | St. Vincent and the Grenadines | 4.1 /100 | #227 | Tragic $88,888 |
| Immigrants | Bosnia and Herzegovina | 4.0 /100 | #228 | Tragic $88,819 |
Demographics Similar to Immigrants from Saudi Arabia by Householder Income Ages 25 - 44 years
In terms of householder income ages 25 - 44 years, the demographic groups most similar to Immigrants from Saudi Arabia are Swiss ($95,511, a difference of 0.060%), Immigrants from Portugal ($95,512, a difference of 0.070%), South American ($95,362, a difference of 0.090%), Icelander ($95,560, a difference of 0.11%), and Costa Rican ($95,565, a difference of 0.12%).
| Demographics | Rating | Rank | Householder Income Ages 25 - 44 years |
| Immigrants | Germany | 67.9 /100 | #156 | Good $95,913 |
| Immigrants | Uganda | 65.2 /100 | #157 | Good $95,698 |
| Scandinavians | 63.9 /100 | #158 | Good $95,596 |
| Costa Ricans | 63.5 /100 | #159 | Good $95,565 |
| Icelanders | 63.4 /100 | #160 | Good $95,560 |
| Immigrants | Portugal | 62.8 /100 | #161 | Good $95,512 |
| Swiss | 62.8 /100 | #162 | Good $95,511 |
| Immigrants | Saudi Arabia | 62.0 /100 | #163 | Good $95,450 |
| South Americans | 60.9 /100 | #164 | Good $95,362 |
| Immigrants | Nepal | 60.3 /100 | #165 | Good $95,322 |
| Immigrants | Ethiopia | 59.5 /100 | #166 | Average $95,256 |
| Czechoslovakians | 57.0 /100 | #167 | Average $95,070 |
| Alsatians | 56.8 /100 | #168 | Average $95,059 |
| Native Hawaiians | 56.8 /100 | #169 | Average $95,058 |
| Slovaks | 56.4 /100 | #170 | Average $95,032 |