Immigrants from Portugal vs Ugandan 4th Grade
COMPARE
Immigrants from Portugal
Ugandan
4th Grade
4th Grade Comparison
Immigrants from Portugal
Ugandans
96.6%
4TH GRADE
0.0/ 100
METRIC RATING
295th/ 347
METRIC RANK
97.6%
4TH GRADE
58.9/ 100
METRIC RATING
164th/ 347
METRIC RANK
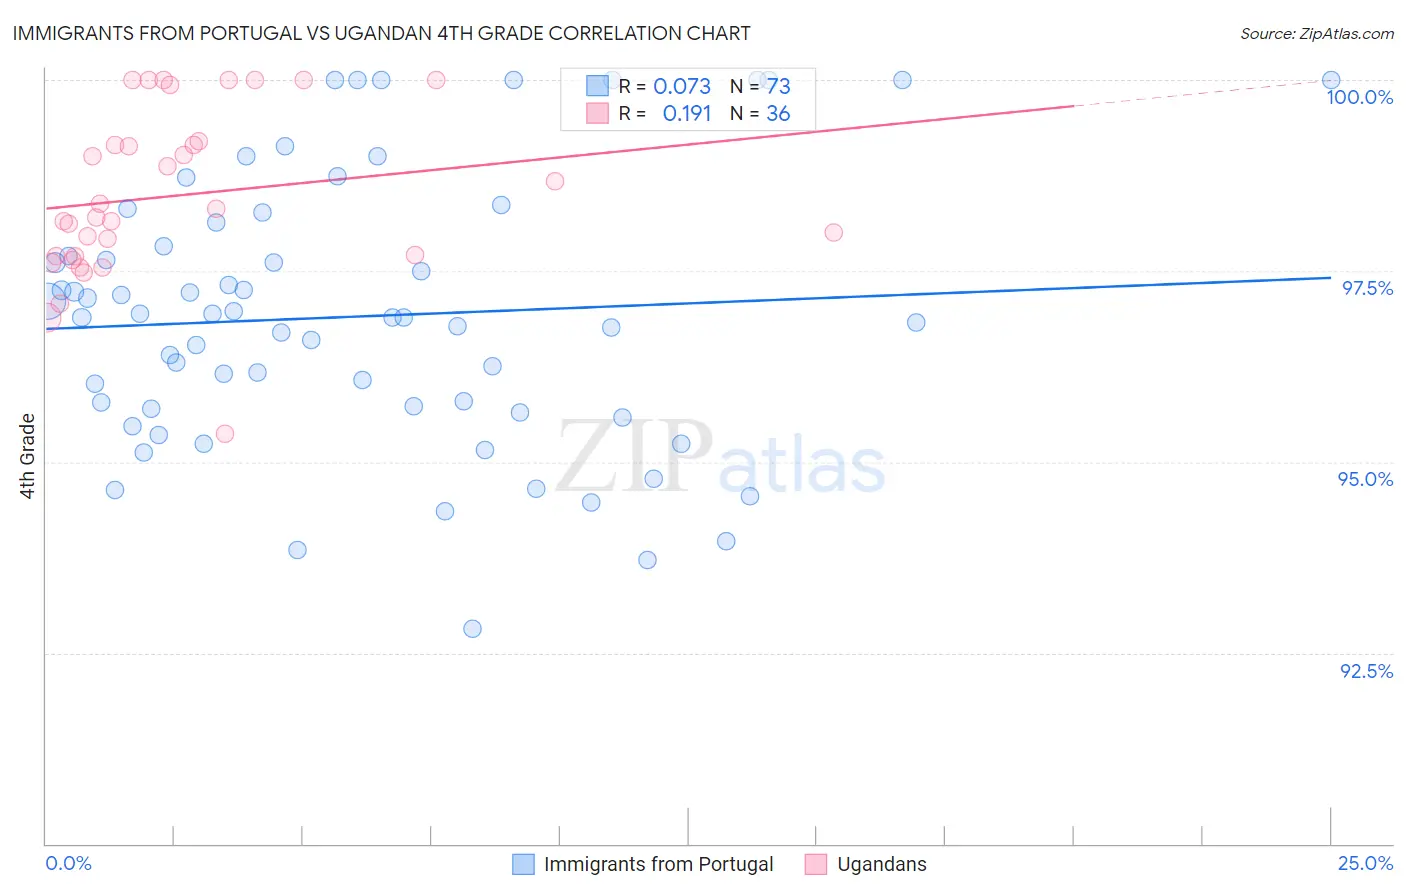
Immigrants from Portugal vs Ugandan 4th Grade Correlation Chart
The statistical analysis conducted on geographies consisting of 174,792,107 people shows a slight positive correlation between the proportion of Immigrants from Portugal and percentage of population with at least 4th grade education in the United States with a correlation coefficient (R) of 0.073 and weighted average of 96.6%. Similarly, the statistical analysis conducted on geographies consisting of 93,991,892 people shows a poor positive correlation between the proportion of Ugandans and percentage of population with at least 4th grade education in the United States with a correlation coefficient (R) of 0.191 and weighted average of 97.6%, a difference of 0.94%.
4th Grade Correlation Summary
| Measurement | Immigrants from Portugal | Ugandan |
| Minimum | 92.8% | 95.4% |
| Maximum | 100.0% | 100.0% |
| Range | 7.2% | 4.6% |
| Mean | 96.9% | 98.5% |
| Median | 96.9% | 98.3% |
| Interquartile 25% (IQ1) | 95.7% | 97.7% |
| Interquartile 75% (IQ3) | 98.0% | 99.2% |
| Interquartile Range (IQR) | 2.3% | 1.5% |
| Standard Deviation (Sample) | 1.8% | 1.1% |
| Standard Deviation (Population) | 1.8% | 1.1% |
Similar Demographics by 4th Grade
Demographics Similar to Immigrants from Portugal by 4th Grade
In terms of 4th grade, the demographic groups most similar to Immigrants from Portugal are Somali (96.6%, a difference of 0.010%), Immigrants from Eritrea (96.7%, a difference of 0.020%), Puerto Rican (96.7%, a difference of 0.040%), Malaysian (96.7%, a difference of 0.060%), and Immigrants from Grenada (96.7%, a difference of 0.070%).
| Demographics | Rating | Rank | 4th Grade |
| Immigrants | Afghanistan | 0.0 /100 | #288 | Tragic 96.8% |
| Immigrants | West Indies | 0.0 /100 | #289 | Tragic 96.7% |
| British West Indians | 0.0 /100 | #290 | Tragic 96.7% |
| Immigrants | Grenada | 0.0 /100 | #291 | Tragic 96.7% |
| Malaysians | 0.0 /100 | #292 | Tragic 96.7% |
| Puerto Ricans | 0.0 /100 | #293 | Tragic 96.7% |
| Immigrants | Eritrea | 0.0 /100 | #294 | Tragic 96.7% |
| Immigrants | Portugal | 0.0 /100 | #295 | Tragic 96.6% |
| Somalis | 0.0 /100 | #296 | Tragic 96.6% |
| Immigrants | Somalia | 0.0 /100 | #297 | Tragic 96.5% |
| Haitians | 0.0 /100 | #298 | Tragic 96.5% |
| Immigrants | Dominica | 0.0 /100 | #299 | Tragic 96.5% |
| Immigrants | South Eastern Asia | 0.0 /100 | #300 | Tragic 96.5% |
| Immigrants | Immigrants | 0.0 /100 | #301 | Tragic 96.5% |
| Immigrants | Cuba | 0.0 /100 | #302 | Tragic 96.4% |
Demographics Similar to Ugandans by 4th Grade
In terms of 4th grade, the demographic groups most similar to Ugandans are Venezuelan (97.6%, a difference of 0.0%), Apache (97.6%, a difference of 0.010%), Marshallese (97.6%, a difference of 0.010%), Bermudan (97.6%, a difference of 0.010%), and Immigrants from Iran (97.6%, a difference of 0.010%).
| Demographics | Rating | Rank | 4th Grade |
| Immigrants | Bosnia and Herzegovina | 66.0 /100 | #157 | Good 97.6% |
| French American Indians | 65.9 /100 | #158 | Good 97.6% |
| Immigrants | Italy | 63.7 /100 | #159 | Good 97.6% |
| Apache | 61.3 /100 | #160 | Good 97.6% |
| Marshallese | 60.8 /100 | #161 | Good 97.6% |
| Bermudans | 60.5 /100 | #162 | Good 97.6% |
| Immigrants | Iran | 60.3 /100 | #163 | Good 97.6% |
| Ugandans | 58.9 /100 | #164 | Average 97.6% |
| Venezuelans | 58.7 /100 | #165 | Average 97.6% |
| Kenyans | 56.5 /100 | #166 | Average 97.5% |
| Immigrants | Poland | 55.9 /100 | #167 | Average 97.5% |
| Immigrants | Belarus | 55.8 /100 | #168 | Average 97.5% |
| Chileans | 54.4 /100 | #169 | Average 97.5% |
| Immigrants | Spain | 51.8 /100 | #170 | Average 97.5% |
| Brazilians | 51.5 /100 | #171 | Average 97.5% |