Immigrants from South Africa vs Okinawan 2 or more Vehicles in Household
COMPARE
Immigrants from South Africa
Okinawan
2 or more Vehicles in Household
2 or more Vehicles in Household Comparison
Immigrants from South Africa
Okinawans
56.7%
2 OR MORE VEHICLES IN HOUSEHOLD
92.5/ 100
METRIC RATING
122nd/ 347
METRIC RANK
51.2%
2 OR MORE VEHICLES IN HOUSEHOLD
0.1/ 100
METRIC RATING
288th/ 347
METRIC RANK
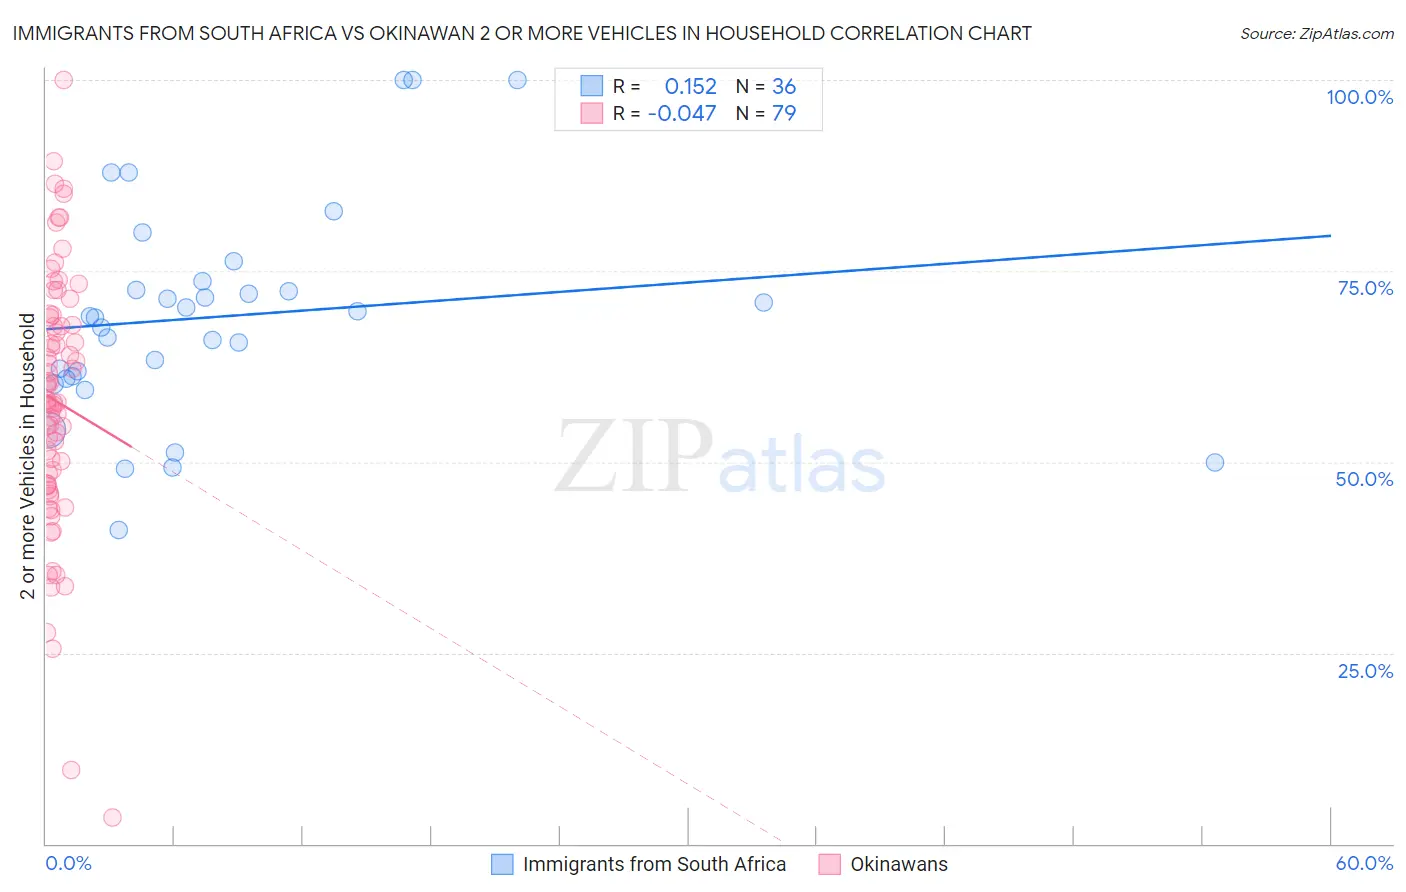
Immigrants from South Africa vs Okinawan 2 or more Vehicles in Household Correlation Chart
The statistical analysis conducted on geographies consisting of 233,271,221 people shows a poor positive correlation between the proportion of Immigrants from South Africa and percentage of households with 2 or more vehicles available in the United States with a correlation coefficient (R) of 0.152 and weighted average of 56.7%. Similarly, the statistical analysis conducted on geographies consisting of 73,742,117 people shows no correlation between the proportion of Okinawans and percentage of households with 2 or more vehicles available in the United States with a correlation coefficient (R) of -0.047 and weighted average of 51.2%, a difference of 10.7%.
2 or more Vehicles in Household Correlation Summary
| Measurement | Immigrants from South Africa | Okinawan |
| Minimum | 41.1% | 3.5% |
| Maximum | 100.0% | 100.0% |
| Range | 58.9% | 96.5% |
| Mean | 69.1% | 58.0% |
| Median | 69.0% | 57.7% |
| Interquartile 25% (IQ1) | 61.1% | 46.9% |
| Interquartile 75% (IQ3) | 73.1% | 68.9% |
| Interquartile Range (IQR) | 12.0% | 22.0% |
| Standard Deviation (Sample) | 14.1% | 17.1% |
| Standard Deviation (Population) | 13.9% | 17.0% |
Similar Demographics by 2 or more Vehicles in Household
Demographics Similar to Immigrants from South Africa by 2 or more Vehicles in Household
In terms of 2 or more vehicles in household, the demographic groups most similar to Immigrants from South Africa are Australian (56.7%, a difference of 0.090%), New Zealander (56.7%, a difference of 0.10%), Tsimshian (56.7%, a difference of 0.12%), Sioux (56.8%, a difference of 0.20%), and Estonian (56.6%, a difference of 0.20%).
| Demographics | Rating | Rank | 2 or more Vehicles in Household |
| Chippewa | 96.6 /100 | #115 | Exceptional 57.2% |
| Immigrants | Jordan | 96.6 /100 | #116 | Exceptional 57.2% |
| Iraqis | 95.8 /100 | #117 | Exceptional 57.1% |
| Asians | 95.1 /100 | #118 | Exceptional 57.0% |
| Natives/Alaskans | 95.0 /100 | #119 | Exceptional 57.0% |
| Costa Ricans | 94.7 /100 | #120 | Exceptional 56.9% |
| Sioux | 93.8 /100 | #121 | Exceptional 56.8% |
| Immigrants | South Africa | 92.5 /100 | #122 | Exceptional 56.7% |
| Australians | 91.8 /100 | #123 | Exceptional 56.7% |
| New Zealanders | 91.8 /100 | #124 | Exceptional 56.7% |
| Tsimshian | 91.6 /100 | #125 | Exceptional 56.7% |
| Estonians | 90.9 /100 | #126 | Exceptional 56.6% |
| Immigrants | Thailand | 90.7 /100 | #127 | Exceptional 56.6% |
| Immigrants | South Central Asia | 90.5 /100 | #128 | Exceptional 56.6% |
| Ute | 90.4 /100 | #129 | Exceptional 56.6% |
Demographics Similar to Okinawans by 2 or more Vehicles in Household
In terms of 2 or more vehicles in household, the demographic groups most similar to Okinawans are Immigrants from Serbia (51.3%, a difference of 0.12%), Immigrants from Liberia (51.3%, a difference of 0.14%), Somali (51.1%, a difference of 0.28%), Immigrants from Uruguay (51.4%, a difference of 0.29%), and Immigrants from Panama (51.1%, a difference of 0.35%).
| Demographics | Rating | Rank | 2 or more Vehicles in Household |
| Immigrants | Kazakhstan | 0.1 /100 | #281 | Tragic 51.6% |
| Bahamians | 0.1 /100 | #282 | Tragic 51.5% |
| Immigrants | China | 0.1 /100 | #283 | Tragic 51.5% |
| Immigrants | Zaire | 0.1 /100 | #284 | Tragic 51.5% |
| Immigrants | Uruguay | 0.1 /100 | #285 | Tragic 51.4% |
| Immigrants | Liberia | 0.1 /100 | #286 | Tragic 51.3% |
| Immigrants | Serbia | 0.1 /100 | #287 | Tragic 51.3% |
| Okinawans | 0.1 /100 | #288 | Tragic 51.2% |
| Somalis | 0.0 /100 | #289 | Tragic 51.1% |
| Immigrants | Panama | 0.0 /100 | #290 | Tragic 51.1% |
| Belizeans | 0.0 /100 | #291 | Tragic 51.0% |
| Immigrants | Ukraine | 0.0 /100 | #292 | Tragic 50.9% |
| Blacks/African Americans | 0.0 /100 | #293 | Tragic 50.9% |
| Bermudans | 0.0 /100 | #294 | Tragic 50.6% |
| Cypriots | 0.0 /100 | #295 | Tragic 50.6% |