Immigrants from Portugal vs Okinawan In Labor Force | Age > 16
COMPARE
Immigrants from Portugal
Okinawan
In Labor Force | Age > 16
In Labor Force | Age > 16 Comparison
Immigrants from Portugal
Okinawans
65.0%
IN LABOR FORCE | AGE > 16
34.8/ 100
METRIC RATING
188th/ 347
METRIC RANK
65.9%
IN LABOR FORCE | AGE > 16
98.7/ 100
METRIC RATING
100th/ 347
METRIC RANK
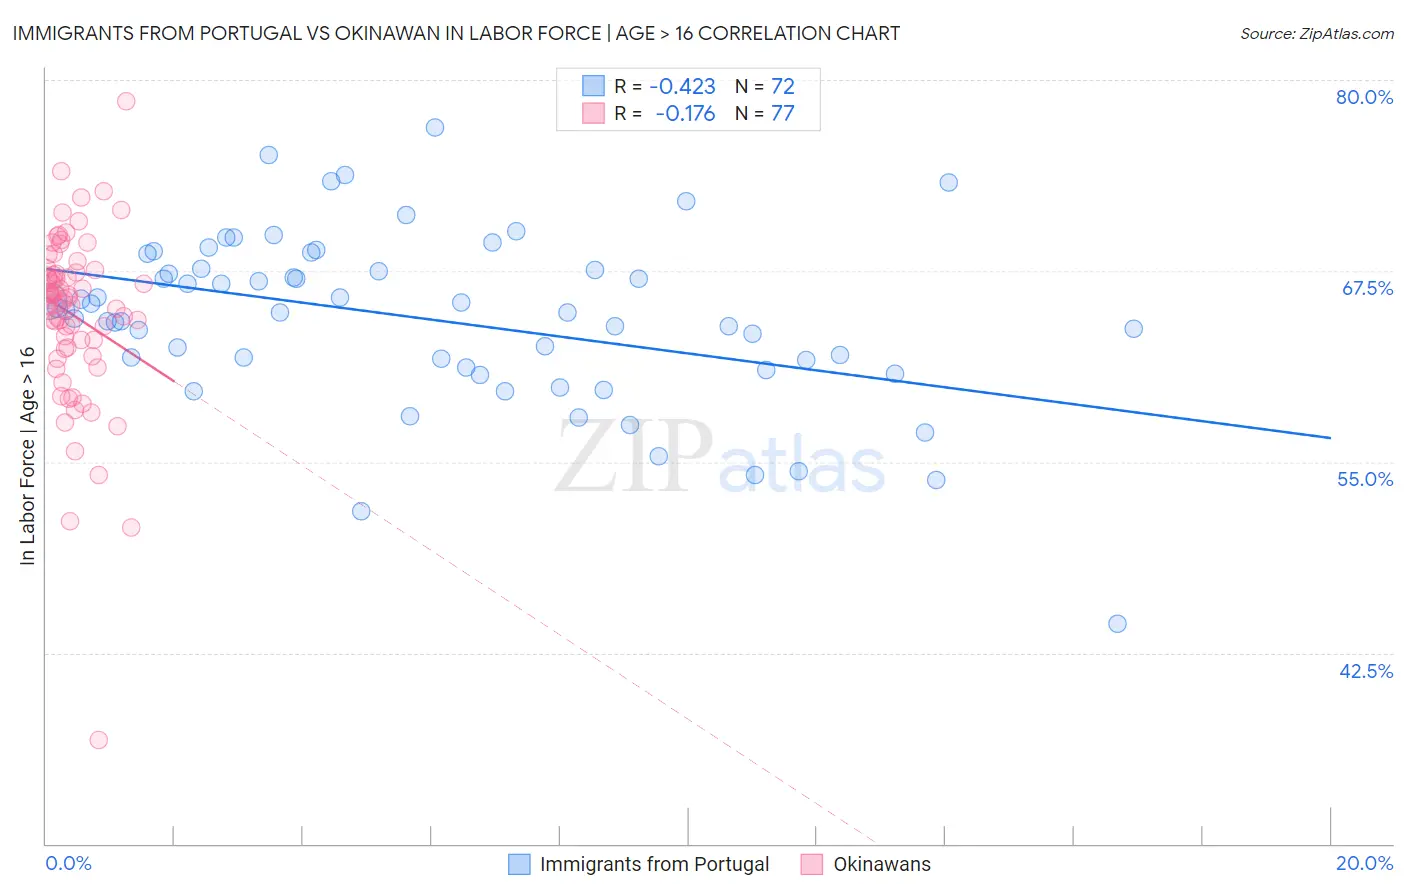
Immigrants from Portugal vs Okinawan In Labor Force | Age > 16 Correlation Chart
The statistical analysis conducted on geographies consisting of 174,779,205 people shows a moderate negative correlation between the proportion of Immigrants from Portugal and labor force participation rate among population ages 16 and over in the United States with a correlation coefficient (R) of -0.423 and weighted average of 65.0%. Similarly, the statistical analysis conducted on geographies consisting of 73,766,468 people shows a poor negative correlation between the proportion of Okinawans and labor force participation rate among population ages 16 and over in the United States with a correlation coefficient (R) of -0.176 and weighted average of 65.9%, a difference of 1.4%.
In Labor Force | Age > 16 Correlation Summary
| Measurement | Immigrants from Portugal | Okinawan |
| Minimum | 44.4% | 36.8% |
| Maximum | 76.9% | 78.6% |
| Range | 32.5% | 41.8% |
| Mean | 64.4% | 64.6% |
| Median | 64.9% | 65.7% |
| Interquartile 25% (IQ1) | 61.5% | 62.5% |
| Interquartile 75% (IQ3) | 67.6% | 67.5% |
| Interquartile Range (IQR) | 6.2% | 5.0% |
| Standard Deviation (Sample) | 5.7% | 5.8% |
| Standard Deviation (Population) | 5.6% | 5.8% |
Similar Demographics by In Labor Force | Age > 16
Demographics Similar to Immigrants from Portugal by In Labor Force | Age > 16
In terms of in labor force | age > 16, the demographic groups most similar to Immigrants from Portugal are Immigrants from Croatia (65.0%, a difference of 0.010%), Immigrants from Greece (65.0%, a difference of 0.010%), Barbadian (65.0%, a difference of 0.010%), Scandinavian (65.0%, a difference of 0.010%), and Immigrants from Fiji (65.0%, a difference of 0.010%).
| Demographics | Rating | Rank | In Labor Force | Age > 16 |
| Immigrants | Panama | 42.4 /100 | #181 | Average 65.1% |
| Immigrants | Nicaragua | 41.1 /100 | #182 | Average 65.1% |
| Soviet Union | 40.5 /100 | #183 | Average 65.0% |
| Carpatho Rusyns | 40.0 /100 | #184 | Average 65.0% |
| Syrians | 40.0 /100 | #185 | Average 65.0% |
| Immigrants | Switzerland | 38.2 /100 | #186 | Fair 65.0% |
| Immigrants | Croatia | 35.7 /100 | #187 | Fair 65.0% |
| Immigrants | Portugal | 34.8 /100 | #188 | Fair 65.0% |
| Immigrants | Greece | 34.3 /100 | #189 | Fair 65.0% |
| Barbadians | 33.9 /100 | #190 | Fair 65.0% |
| Scandinavians | 33.7 /100 | #191 | Fair 65.0% |
| Immigrants | Fiji | 33.7 /100 | #192 | Fair 65.0% |
| Immigrants | Europe | 33.6 /100 | #193 | Fair 65.0% |
| Immigrants | Southern Europe | 31.3 /100 | #194 | Fair 65.0% |
| Romanians | 31.1 /100 | #195 | Fair 65.0% |
Demographics Similar to Okinawans by In Labor Force | Age > 16
In terms of in labor force | age > 16, the demographic groups most similar to Okinawans are Immigrants from Australia (65.9%, a difference of 0.0%), Immigrants from Colombia (65.9%, a difference of 0.010%), Uruguayan (65.9%, a difference of 0.010%), Immigrants from Chile (65.9%, a difference of 0.020%), and Immigrants from South Eastern Asia (65.9%, a difference of 0.030%).
| Demographics | Rating | Rank | In Labor Force | Age > 16 |
| Immigrants | South America | 99.1 /100 | #93 | Exceptional 66.0% |
| Immigrants | Cambodia | 99.1 /100 | #94 | Exceptional 66.0% |
| Immigrants | Uruguay | 99.1 /100 | #95 | Exceptional 66.0% |
| Bangladeshis | 98.9 /100 | #96 | Exceptional 65.9% |
| Filipinos | 98.9 /100 | #97 | Exceptional 65.9% |
| Immigrants | Chile | 98.7 /100 | #98 | Exceptional 65.9% |
| Immigrants | Australia | 98.7 /100 | #99 | Exceptional 65.9% |
| Okinawans | 98.7 /100 | #100 | Exceptional 65.9% |
| Immigrants | Colombia | 98.6 /100 | #101 | Exceptional 65.9% |
| Uruguayans | 98.6 /100 | #102 | Exceptional 65.9% |
| Immigrants | South Eastern Asia | 98.5 /100 | #103 | Exceptional 65.9% |
| Palestinians | 98.5 /100 | #104 | Exceptional 65.9% |
| Colombians | 98.4 /100 | #105 | Exceptional 65.9% |
| Immigrants | Serbia | 98.1 /100 | #106 | Exceptional 65.8% |
| Immigrants | Poland | 98.1 /100 | #107 | Exceptional 65.8% |