Immigrants from Poland vs Immigrants from Sudan 2 or more Vehicles in Household
COMPARE
Immigrants from Poland
Immigrants from Sudan
2 or more Vehicles in Household
2 or more Vehicles in Household Comparison
Immigrants from Poland
Immigrants from Sudan
54.6%
2 OR MORE VEHICLES IN HOUSEHOLD
19.3/ 100
METRIC RATING
196th/ 347
METRIC RANK
52.8%
2 OR MORE VEHICLES IN HOUSEHOLD
1.0/ 100
METRIC RATING
251st/ 347
METRIC RANK
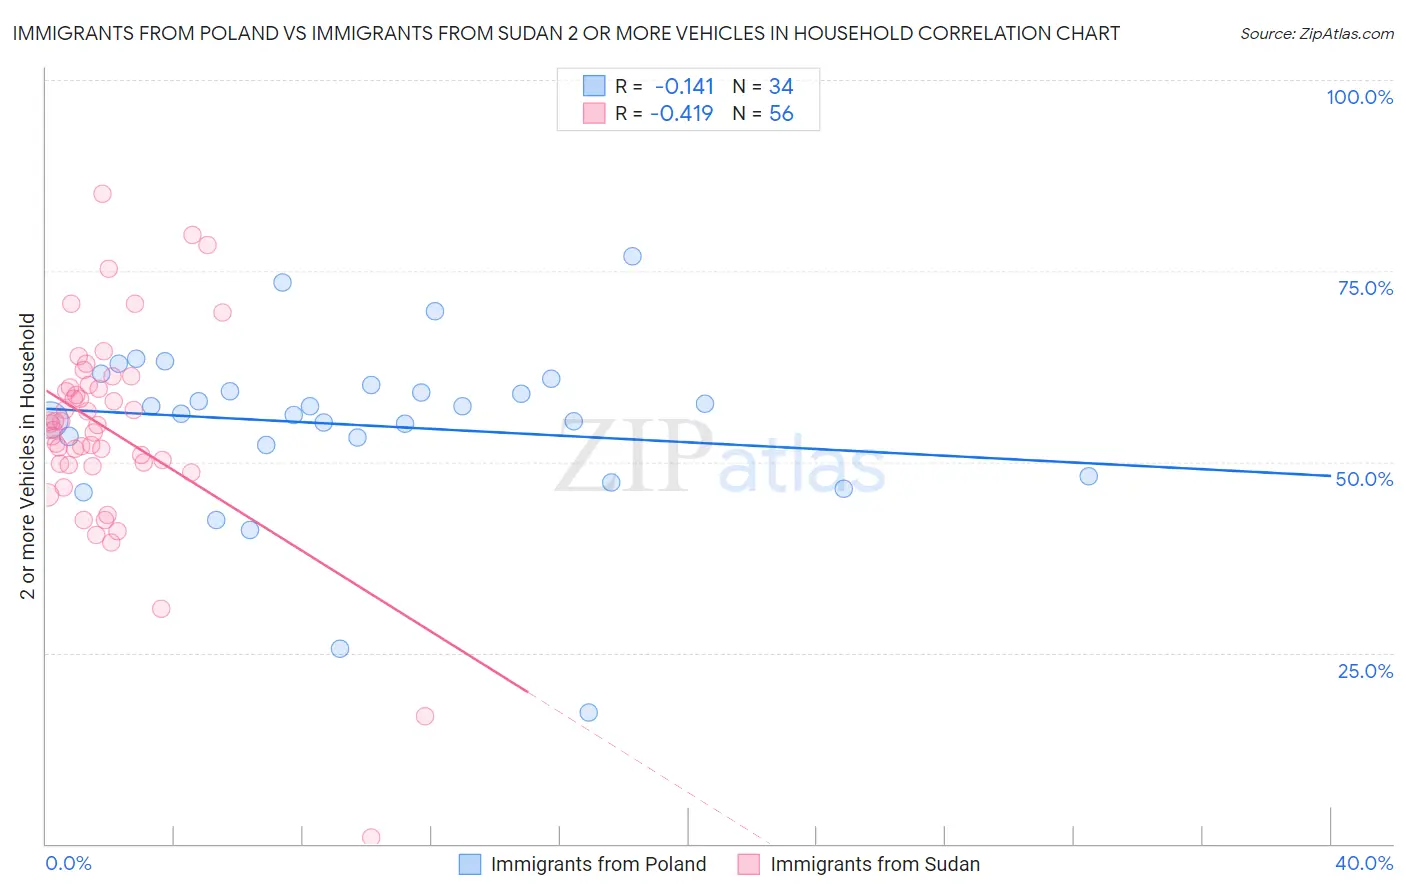
Immigrants from Poland vs Immigrants from Sudan 2 or more Vehicles in Household Correlation Chart
The statistical analysis conducted on geographies consisting of 304,779,004 people shows a poor negative correlation between the proportion of Immigrants from Poland and percentage of households with 2 or more vehicles available in the United States with a correlation coefficient (R) of -0.141 and weighted average of 54.6%. Similarly, the statistical analysis conducted on geographies consisting of 118,954,580 people shows a moderate negative correlation between the proportion of Immigrants from Sudan and percentage of households with 2 or more vehicles available in the United States with a correlation coefficient (R) of -0.419 and weighted average of 52.8%, a difference of 3.3%.
2 or more Vehicles in Household Correlation Summary
| Measurement | Immigrants from Poland | Immigrants from Sudan |
| Minimum | 17.2% | 0.83% |
| Maximum | 76.9% | 85.2% |
| Range | 59.6% | 84.3% |
| Mean | 54.8% | 54.2% |
| Median | 56.7% | 55.0% |
| Interquartile 25% (IQ1) | 52.2% | 49.7% |
| Interquartile 75% (IQ3) | 60.1% | 59.9% |
| Interquartile Range (IQR) | 8.0% | 10.2% |
| Standard Deviation (Sample) | 11.5% | 13.6% |
| Standard Deviation (Population) | 11.3% | 13.5% |
Similar Demographics by 2 or more Vehicles in Household
Demographics Similar to Immigrants from Poland by 2 or more Vehicles in Household
In terms of 2 or more vehicles in household, the demographic groups most similar to Immigrants from Poland are Argentinean (54.5%, a difference of 0.12%), Iroquois (54.7%, a difference of 0.20%), Carpatho Rusyn (54.4%, a difference of 0.21%), Central American (54.7%, a difference of 0.22%), and Immigrants from Norway (54.4%, a difference of 0.24%).
| Demographics | Rating | Rank | 2 or more Vehicles in Household |
| Eastern Europeans | 27.5 /100 | #189 | Fair 54.8% |
| Russians | 26.3 /100 | #190 | Fair 54.8% |
| Immigrants | Immigrants | 25.0 /100 | #191 | Fair 54.7% |
| Immigrants | Romania | 23.8 /100 | #192 | Fair 54.7% |
| Immigrants | Japan | 23.4 /100 | #193 | Fair 54.7% |
| Central Americans | 23.0 /100 | #194 | Fair 54.7% |
| Iroquois | 22.6 /100 | #195 | Fair 54.7% |
| Immigrants | Poland | 19.3 /100 | #196 | Poor 54.6% |
| Argentineans | 17.5 /100 | #197 | Poor 54.5% |
| Carpatho Rusyns | 16.2 /100 | #198 | Poor 54.4% |
| Immigrants | Norway | 15.9 /100 | #199 | Poor 54.4% |
| Houma | 15.8 /100 | #200 | Poor 54.4% |
| Immigrants | Italy | 15.5 /100 | #201 | Poor 54.4% |
| Immigrants | North Macedonia | 14.9 /100 | #202 | Poor 54.4% |
| Immigrants | Peru | 14.3 /100 | #203 | Poor 54.4% |
Demographics Similar to Immigrants from Sudan by 2 or more Vehicles in Household
In terms of 2 or more vehicles in household, the demographic groups most similar to Immigrants from Sudan are Immigrants from Portugal (52.8%, a difference of 0.010%), Mongolian (52.8%, a difference of 0.030%), Immigrants from Brazil (52.8%, a difference of 0.040%), Nigerian (52.8%, a difference of 0.060%), and Colombian (52.9%, a difference of 0.090%).
| Demographics | Rating | Rank | 2 or more Vehicles in Household |
| Indians (Asian) | 1.7 /100 | #244 | Tragic 53.1% |
| Immigrants | Ethiopia | 1.5 /100 | #245 | Tragic 53.0% |
| Immigrants | Nigeria | 1.2 /100 | #246 | Tragic 52.9% |
| Sierra Leoneans | 1.2 /100 | #247 | Tragic 52.9% |
| Colombians | 1.1 /100 | #248 | Tragic 52.9% |
| Immigrants | Brazil | 1.0 /100 | #249 | Tragic 52.8% |
| Mongolians | 1.0 /100 | #250 | Tragic 52.8% |
| Immigrants | Sudan | 1.0 /100 | #251 | Tragic 52.8% |
| Immigrants | Portugal | 1.0 /100 | #252 | Tragic 52.8% |
| Nigerians | 0.9 /100 | #253 | Tragic 52.8% |
| Immigrants | Malaysia | 0.8 /100 | #254 | Tragic 52.7% |
| Uruguayans | 0.7 /100 | #255 | Tragic 52.7% |
| Immigrants | Eritrea | 0.7 /100 | #256 | Tragic 52.6% |
| Immigrants | Hong Kong | 0.6 /100 | #257 | Tragic 52.6% |
| Central American Indians | 0.6 /100 | #258 | Tragic 52.5% |