Immigrants from Pakistan vs Pima Currently Married
COMPARE
Immigrants from Pakistan
Pima
Currently Married
Currently Married Comparison
Immigrants from Pakistan
Pima
49.1%
CURRENTLY MARRIED
99.7/ 100
METRIC RATING
23rd/ 347
METRIC RANK
35.9%
CURRENTLY MARRIED
0.0/ 100
METRIC RATING
347th/ 347
METRIC RANK
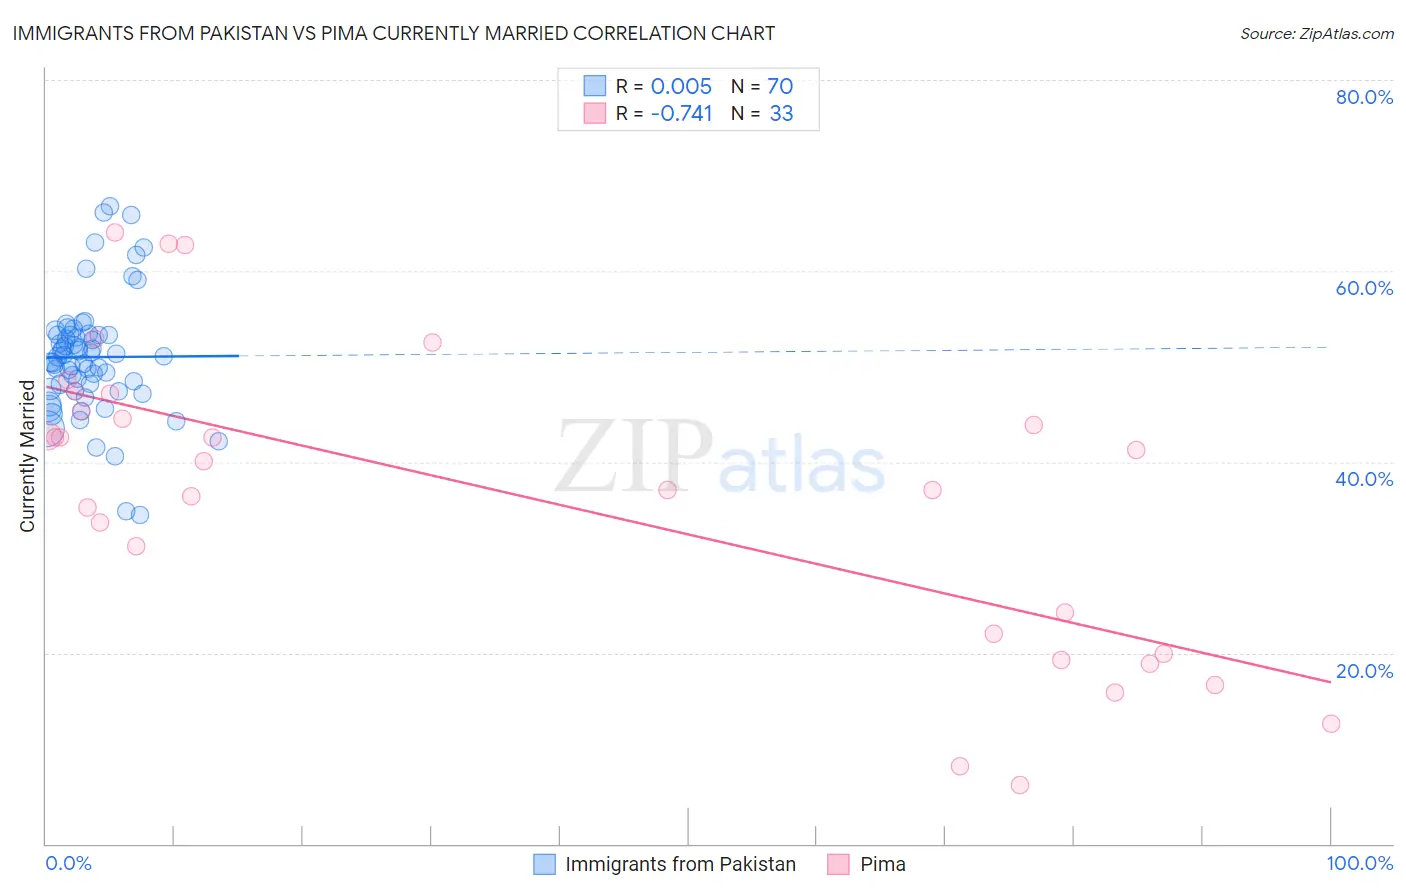
Immigrants from Pakistan vs Pima Currently Married Correlation Chart
The statistical analysis conducted on geographies consisting of 283,886,869 people shows no correlation between the proportion of Immigrants from Pakistan and percentage of population currently married in the United States with a correlation coefficient (R) of 0.005 and weighted average of 49.1%. Similarly, the statistical analysis conducted on geographies consisting of 61,552,342 people shows a strong negative correlation between the proportion of Pima and percentage of population currently married in the United States with a correlation coefficient (R) of -0.741 and weighted average of 35.9%, a difference of 36.6%.
Currently Married Correlation Summary
| Measurement | Immigrants from Pakistan | Pima |
| Minimum | 34.4% | 6.2% |
| Maximum | 66.7% | 64.0% |
| Range | 32.3% | 57.8% |
| Mean | 51.0% | 36.3% |
| Median | 51.1% | 40.1% |
| Interquartile 25% (IQ1) | 47.6% | 21.0% |
| Interquartile 75% (IQ3) | 53.3% | 46.2% |
| Interquartile Range (IQR) | 5.7% | 25.2% |
| Standard Deviation (Sample) | 6.2% | 15.6% |
| Standard Deviation (Population) | 6.1% | 15.4% |
Similar Demographics by Currently Married
Demographics Similar to Immigrants from Pakistan by Currently Married
In terms of currently married, the demographic groups most similar to Immigrants from Pakistan are Bulgarian (49.1%, a difference of 0.11%), Lithuanian (49.0%, a difference of 0.11%), Maltese (49.0%, a difference of 0.12%), Immigrants from Korea (49.0%, a difference of 0.17%), and Burmese (48.9%, a difference of 0.24%).
| Demographics | Rating | Rank | Currently Married |
| Chinese | 99.9 /100 | #16 | Exceptional 49.5% |
| Scandinavians | 99.9 /100 | #17 | Exceptional 49.5% |
| Immigrants | Scotland | 99.8 /100 | #18 | Exceptional 49.3% |
| Europeans | 99.8 /100 | #19 | Exceptional 49.3% |
| Luxembourgers | 99.8 /100 | #20 | Exceptional 49.3% |
| Scottish | 99.8 /100 | #21 | Exceptional 49.2% |
| Bulgarians | 99.7 /100 | #22 | Exceptional 49.1% |
| Immigrants | Pakistan | 99.7 /100 | #23 | Exceptional 49.1% |
| Lithuanians | 99.6 /100 | #24 | Exceptional 49.0% |
| Maltese | 99.6 /100 | #25 | Exceptional 49.0% |
| Immigrants | Korea | 99.6 /100 | #26 | Exceptional 49.0% |
| Burmese | 99.6 /100 | #27 | Exceptional 48.9% |
| Welsh | 99.5 /100 | #28 | Exceptional 48.9% |
| Croatians | 99.5 /100 | #29 | Exceptional 48.9% |
| Eastern Europeans | 99.5 /100 | #30 | Exceptional 48.9% |
Demographics Similar to Pima by Currently Married
In terms of currently married, the demographic groups most similar to Pima are Hopi (36.5%, a difference of 1.8%), Tohono O'odham (36.8%, a difference of 2.4%), Immigrants from Cabo Verde (37.8%, a difference of 5.4%), Pueblo (38.2%, a difference of 6.5%), and Immigrants from Dominican Republic (38.9%, a difference of 8.4%).
| Demographics | Rating | Rank | Currently Married |
| Yup'ik | 0.0 /100 | #333 | Tragic 39.9% |
| Puerto Ricans | 0.0 /100 | #334 | Tragic 39.9% |
| Lumbee | 0.0 /100 | #335 | Tragic 39.8% |
| British West Indians | 0.0 /100 | #336 | Tragic 39.8% |
| Blacks/African Americans | 0.0 /100 | #337 | Tragic 39.6% |
| Cape Verdeans | 0.0 /100 | #338 | Tragic 39.6% |
| Dominicans | 0.0 /100 | #339 | Tragic 39.5% |
| Immigrants | Grenada | 0.0 /100 | #340 | Tragic 39.1% |
| Navajo | 0.0 /100 | #341 | Tragic 39.0% |
| Immigrants | Dominican Republic | 0.0 /100 | #342 | Tragic 38.9% |
| Pueblo | 0.0 /100 | #343 | Tragic 38.2% |
| Immigrants | Cabo Verde | 0.0 /100 | #344 | Tragic 37.8% |
| Tohono O'odham | 0.0 /100 | #345 | Tragic 36.8% |
| Hopi | 0.0 /100 | #346 | Tragic 36.5% |
| Pima | 0.0 /100 | #347 | Tragic 35.9% |