Immigrants from Pakistan vs Laotian 2 or more Vehicles in Household
COMPARE
Immigrants from Pakistan
Laotian
2 or more Vehicles in Household
2 or more Vehicles in Household Comparison
Immigrants from Pakistan
Laotians
56.1%
2 OR MORE VEHICLES IN HOUSEHOLD
78.1/ 100
METRIC RATING
152nd/ 347
METRIC RANK
58.6%
2 OR MORE VEHICLES IN HOUSEHOLD
99.7/ 100
METRIC RATING
67th/ 347
METRIC RANK
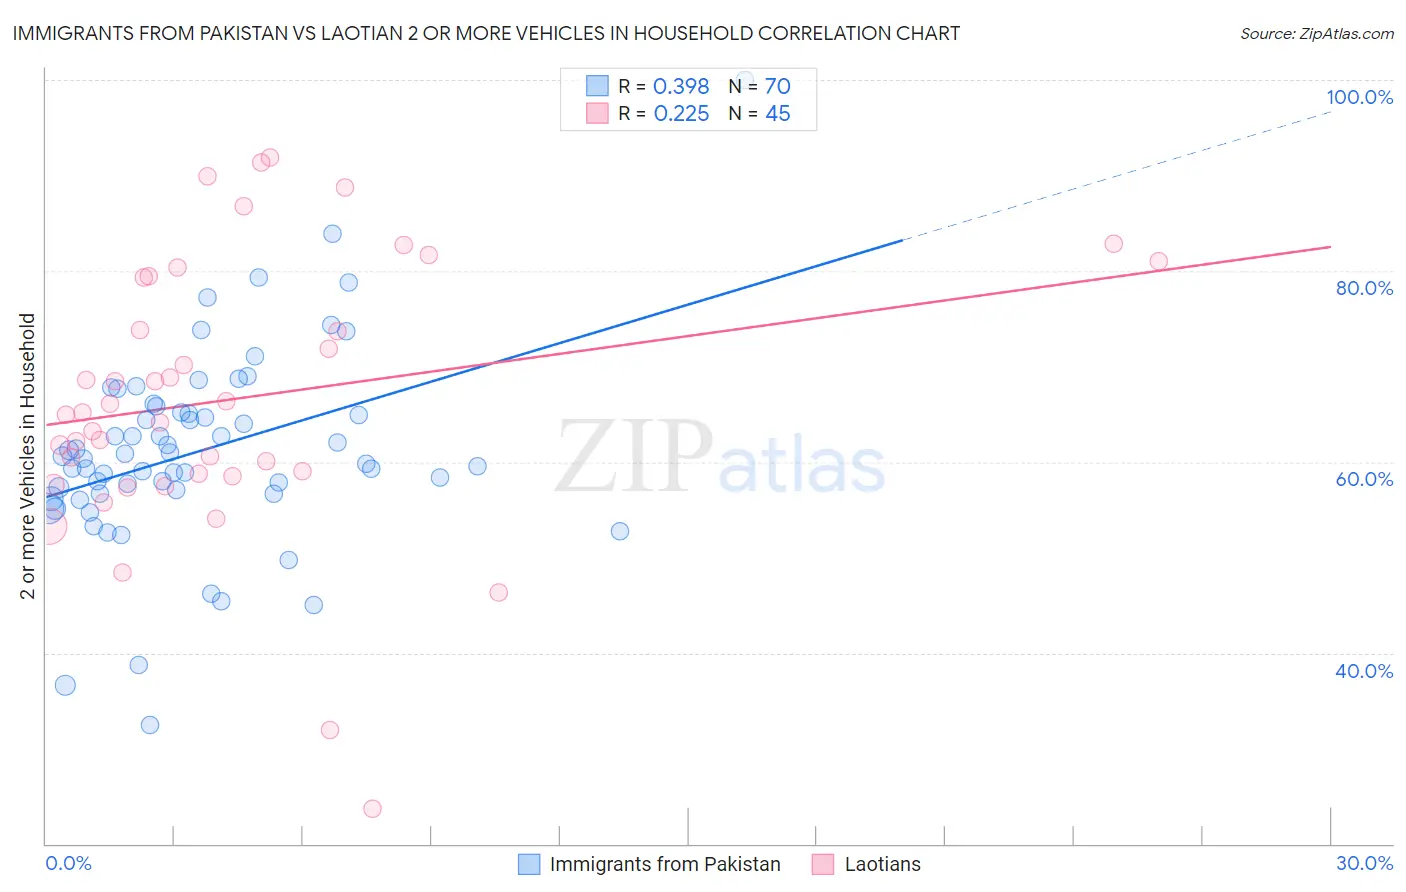
Immigrants from Pakistan vs Laotian 2 or more Vehicles in Household Correlation Chart
The statistical analysis conducted on geographies consisting of 283,700,045 people shows a mild positive correlation between the proportion of Immigrants from Pakistan and percentage of households with 2 or more vehicles available in the United States with a correlation coefficient (R) of 0.398 and weighted average of 56.1%. Similarly, the statistical analysis conducted on geographies consisting of 224,647,130 people shows a weak positive correlation between the proportion of Laotians and percentage of households with 2 or more vehicles available in the United States with a correlation coefficient (R) of 0.225 and weighted average of 58.6%, a difference of 4.5%.
2 or more Vehicles in Household Correlation Summary
| Measurement | Immigrants from Pakistan | Laotian |
| Minimum | 32.5% | 23.7% |
| Maximum | 100.0% | 91.9% |
| Range | 67.5% | 68.2% |
| Mean | 61.1% | 66.6% |
| Median | 60.5% | 65.2% |
| Interquartile 25% (IQ1) | 56.7% | 58.6% |
| Interquartile 75% (IQ3) | 65.2% | 79.4% |
| Interquartile Range (IQR) | 8.5% | 20.8% |
| Standard Deviation (Sample) | 10.3% | 14.5% |
| Standard Deviation (Population) | 10.3% | 14.3% |
Similar Demographics by 2 or more Vehicles in Household
Demographics Similar to Immigrants from Pakistan by 2 or more Vehicles in Household
In terms of 2 or more vehicles in household, the demographic groups most similar to Immigrants from Pakistan are Immigrants from Northern Europe (56.1%, a difference of 0.030%), Nicaraguan (56.1%, a difference of 0.10%), Immigrants from Moldova (56.1%, a difference of 0.12%), Chilean (56.1%, a difference of 0.12%), and Serbian (56.1%, a difference of 0.13%).
| Demographics | Rating | Rank | 2 or more Vehicles in Household |
| Syrians | 81.2 /100 | #145 | Excellent 56.2% |
| Venezuelans | 80.7 /100 | #146 | Excellent 56.1% |
| Serbians | 80.3 /100 | #147 | Excellent 56.1% |
| Immigrants | Moldova | 80.2 /100 | #148 | Excellent 56.1% |
| Chileans | 80.2 /100 | #149 | Excellent 56.1% |
| Nicaraguans | 79.9 /100 | #150 | Good 56.1% |
| Immigrants | Northern Europe | 78.7 /100 | #151 | Good 56.1% |
| Immigrants | Pakistan | 78.1 /100 | #152 | Good 56.1% |
| Lumbee | 71.9 /100 | #153 | Good 55.9% |
| Ukrainians | 70.8 /100 | #154 | Good 55.8% |
| Immigrants | Venezuela | 70.7 /100 | #155 | Good 55.8% |
| Immigrants | Lithuania | 70.4 /100 | #156 | Good 55.8% |
| Immigrants | Kuwait | 70.2 /100 | #157 | Good 55.8% |
| Tlingit-Haida | 68.5 /100 | #158 | Good 55.8% |
| Paiute | 68.0 /100 | #159 | Good 55.8% |
Demographics Similar to Laotians by 2 or more Vehicles in Household
In terms of 2 or more vehicles in household, the demographic groups most similar to Laotians are Canadian (58.6%, a difference of 0.010%), Immigrants from Central America (58.6%, a difference of 0.020%), Croatian (58.6%, a difference of 0.020%), Portuguese (58.6%, a difference of 0.070%), and Pennsylvania German (58.5%, a difference of 0.13%).
| Demographics | Rating | Rank | 2 or more Vehicles in Household |
| French Canadians | 99.8 /100 | #60 | Exceptional 58.9% |
| Osage | 99.8 /100 | #61 | Exceptional 58.8% |
| Immigrants | Nonimmigrants | 99.8 /100 | #62 | Exceptional 58.8% |
| Mexican American Indians | 99.8 /100 | #63 | Exceptional 58.7% |
| Portuguese | 99.7 /100 | #64 | Exceptional 58.6% |
| Immigrants | Central America | 99.7 /100 | #65 | Exceptional 58.6% |
| Croatians | 99.7 /100 | #66 | Exceptional 58.6% |
| Laotians | 99.7 /100 | #67 | Exceptional 58.6% |
| Canadians | 99.7 /100 | #68 | Exceptional 58.6% |
| Pennsylvania Germans | 99.7 /100 | #69 | Exceptional 58.5% |
| Italians | 99.6 /100 | #70 | Exceptional 58.4% |
| Bangladeshis | 99.6 /100 | #71 | Exceptional 58.4% |
| Austrians | 99.6 /100 | #72 | Exceptional 58.4% |
| Bolivians | 99.6 /100 | #73 | Exceptional 58.3% |
| Immigrants | Afghanistan | 99.6 /100 | #74 | Exceptional 58.3% |