Immigrants from North America vs Trinidadian and Tobagonian Master's Degree
COMPARE
Immigrants from North America
Trinidadian and Tobagonian
Master's Degree
Master's Degree Comparison
Immigrants from North America
Trinidadians and Tobagonians
17.2%
MASTER'S DEGREE
99.1/ 100
METRIC RATING
92nd/ 347
METRIC RANK
14.4%
MASTER'S DEGREE
23.5/ 100
METRIC RATING
205th/ 347
METRIC RANK
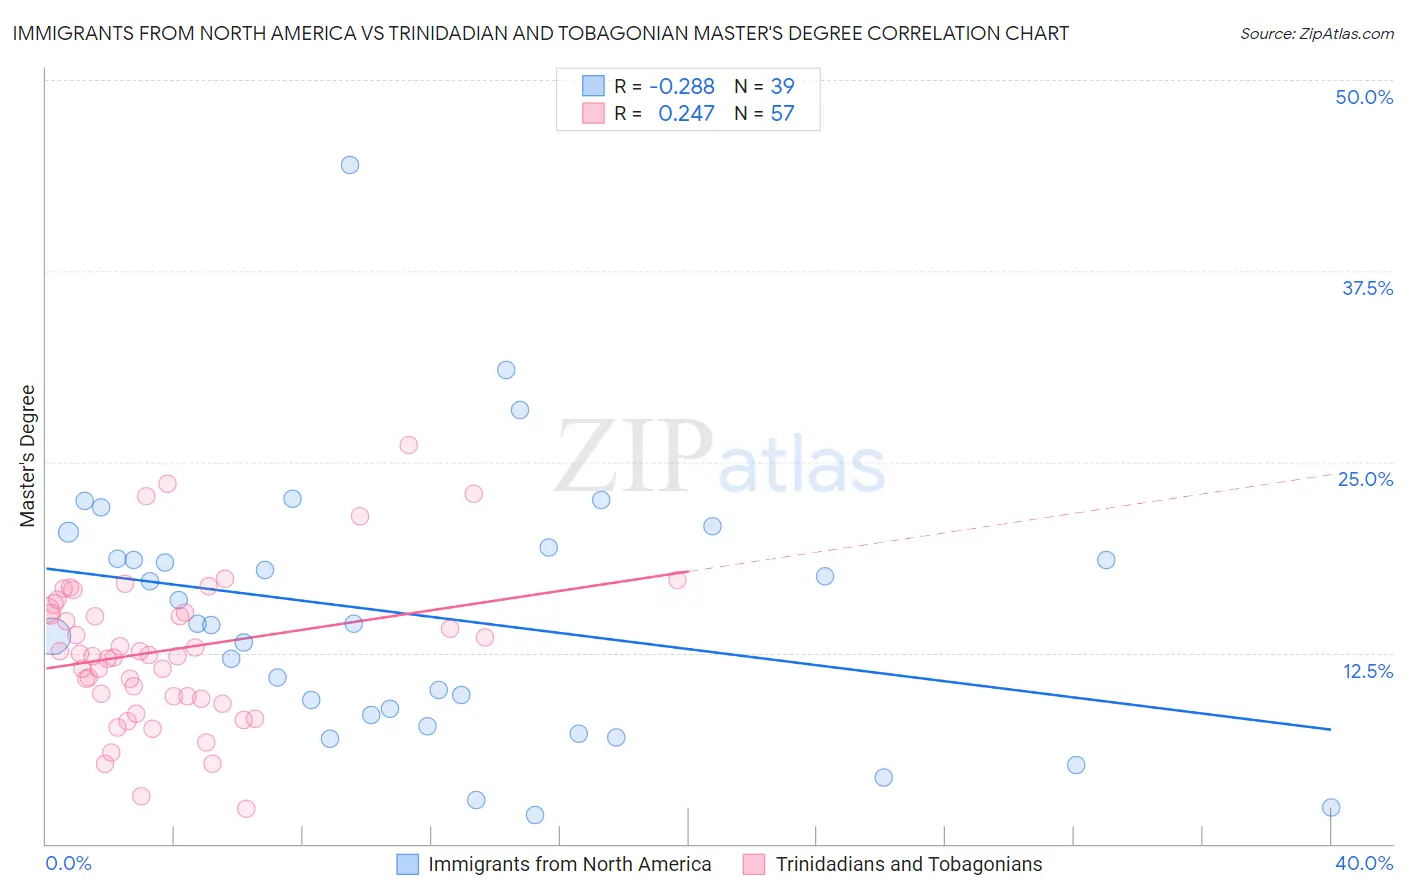
Immigrants from North America vs Trinidadian and Tobagonian Master's Degree Correlation Chart
The statistical analysis conducted on geographies consisting of 462,287,354 people shows a weak negative correlation between the proportion of Immigrants from North America and percentage of population with at least master's degree education in the United States with a correlation coefficient (R) of -0.288 and weighted average of 17.2%. Similarly, the statistical analysis conducted on geographies consisting of 219,795,372 people shows a weak positive correlation between the proportion of Trinidadians and Tobagonians and percentage of population with at least master's degree education in the United States with a correlation coefficient (R) of 0.247 and weighted average of 14.4%, a difference of 19.6%.
Master's Degree Correlation Summary
| Measurement | Immigrants from North America | Trinidadian and Tobagonian |
| Minimum | 1.9% | 2.3% |
| Maximum | 44.5% | 26.1% |
| Range | 42.5% | 23.8% |
| Mean | 14.9% | 12.7% |
| Median | 14.4% | 12.3% |
| Interquartile 25% (IQ1) | 8.4% | 9.6% |
| Interquartile 75% (IQ3) | 19.4% | 15.5% |
| Interquartile Range (IQR) | 11.0% | 5.9% |
| Standard Deviation (Sample) | 8.6% | 4.9% |
| Standard Deviation (Population) | 8.5% | 4.9% |
Similar Demographics by Master's Degree
Demographics Similar to Immigrants from North America by Master's Degree
In terms of master's degree, the demographic groups most similar to Immigrants from North America are Romanian (17.2%, a difference of 0.050%), Immigrants from Italy (17.2%, a difference of 0.060%), Immigrants from Egypt (17.2%, a difference of 0.12%), Bhutanese (17.2%, a difference of 0.14%), and Ugandan (17.1%, a difference of 0.19%).
| Demographics | Rating | Rank | Master's Degree |
| Immigrants | Brazil | 99.4 /100 | #85 | Exceptional 17.4% |
| Immigrants | Croatia | 99.3 /100 | #86 | Exceptional 17.3% |
| Maltese | 99.3 /100 | #87 | Exceptional 17.3% |
| Immigrants | Canada | 99.2 /100 | #88 | Exceptional 17.2% |
| Bhutanese | 99.1 /100 | #89 | Exceptional 17.2% |
| Immigrants | Egypt | 99.1 /100 | #90 | Exceptional 17.2% |
| Romanians | 99.1 /100 | #91 | Exceptional 17.2% |
| Immigrants | North America | 99.1 /100 | #92 | Exceptional 17.2% |
| Immigrants | Italy | 99.1 /100 | #93 | Exceptional 17.2% |
| Ugandans | 99.0 /100 | #94 | Exceptional 17.1% |
| Immigrants | Morocco | 98.9 /100 | #95 | Exceptional 17.1% |
| Immigrants | Northern Africa | 98.9 /100 | #96 | Exceptional 17.1% |
| Immigrants | England | 98.8 /100 | #97 | Exceptional 17.0% |
| Immigrants | Ukraine | 98.8 /100 | #98 | Exceptional 17.0% |
| Laotians | 98.8 /100 | #99 | Exceptional 17.0% |
Demographics Similar to Trinidadians and Tobagonians by Master's Degree
In terms of master's degree, the demographic groups most similar to Trinidadians and Tobagonians are French (14.4%, a difference of 0.030%), Scandinavian (14.4%, a difference of 0.040%), Yugoslavian (14.4%, a difference of 0.15%), Immigrants from Western Africa (14.4%, a difference of 0.26%), and Scotch-Irish (14.4%, a difference of 0.27%).
| Demographics | Rating | Rank | Master's Degree |
| West Indians | 27.4 /100 | #198 | Fair 14.5% |
| Immigrants | Armenia | 27.2 /100 | #199 | Fair 14.5% |
| Panamanians | 25.1 /100 | #200 | Fair 14.4% |
| Scotch-Irish | 25.0 /100 | #201 | Fair 14.4% |
| Immigrants | Western Africa | 24.9 /100 | #202 | Fair 14.4% |
| Yugoslavians | 24.3 /100 | #203 | Fair 14.4% |
| French | 23.7 /100 | #204 | Fair 14.4% |
| Trinidadians and Tobagonians | 23.5 /100 | #205 | Fair 14.4% |
| Scandinavians | 23.3 /100 | #206 | Fair 14.4% |
| Immigrants | Bosnia and Herzegovina | 22.0 /100 | #207 | Fair 14.3% |
| Immigrants | Barbados | 20.5 /100 | #208 | Fair 14.3% |
| Immigrants | Panama | 20.0 /100 | #209 | Fair 14.3% |
| Sub-Saharan Africans | 19.4 /100 | #210 | Poor 14.2% |
| Somalis | 18.0 /100 | #211 | Poor 14.2% |
| Spanish | 17.8 /100 | #212 | Poor 14.2% |