Immigrants from North America vs Trinidadian and Tobagonian Householder Income Ages 25 - 44 years
COMPARE
Immigrants from North America
Trinidadian and Tobagonian
Householder Income Ages 25 - 44 years
Householder Income Ages 25 - 44 years Comparison
Immigrants from North America
Trinidadians and Tobagonians
$102,407
HOUSEHOLDER INCOME AGES 25 - 44 YEARS
98.7/ 100
METRIC RATING
92nd/ 347
METRIC RANK
$89,856
HOUSEHOLDER INCOME AGES 25 - 44 YEARS
6.8/ 100
METRIC RATING
220th/ 347
METRIC RANK
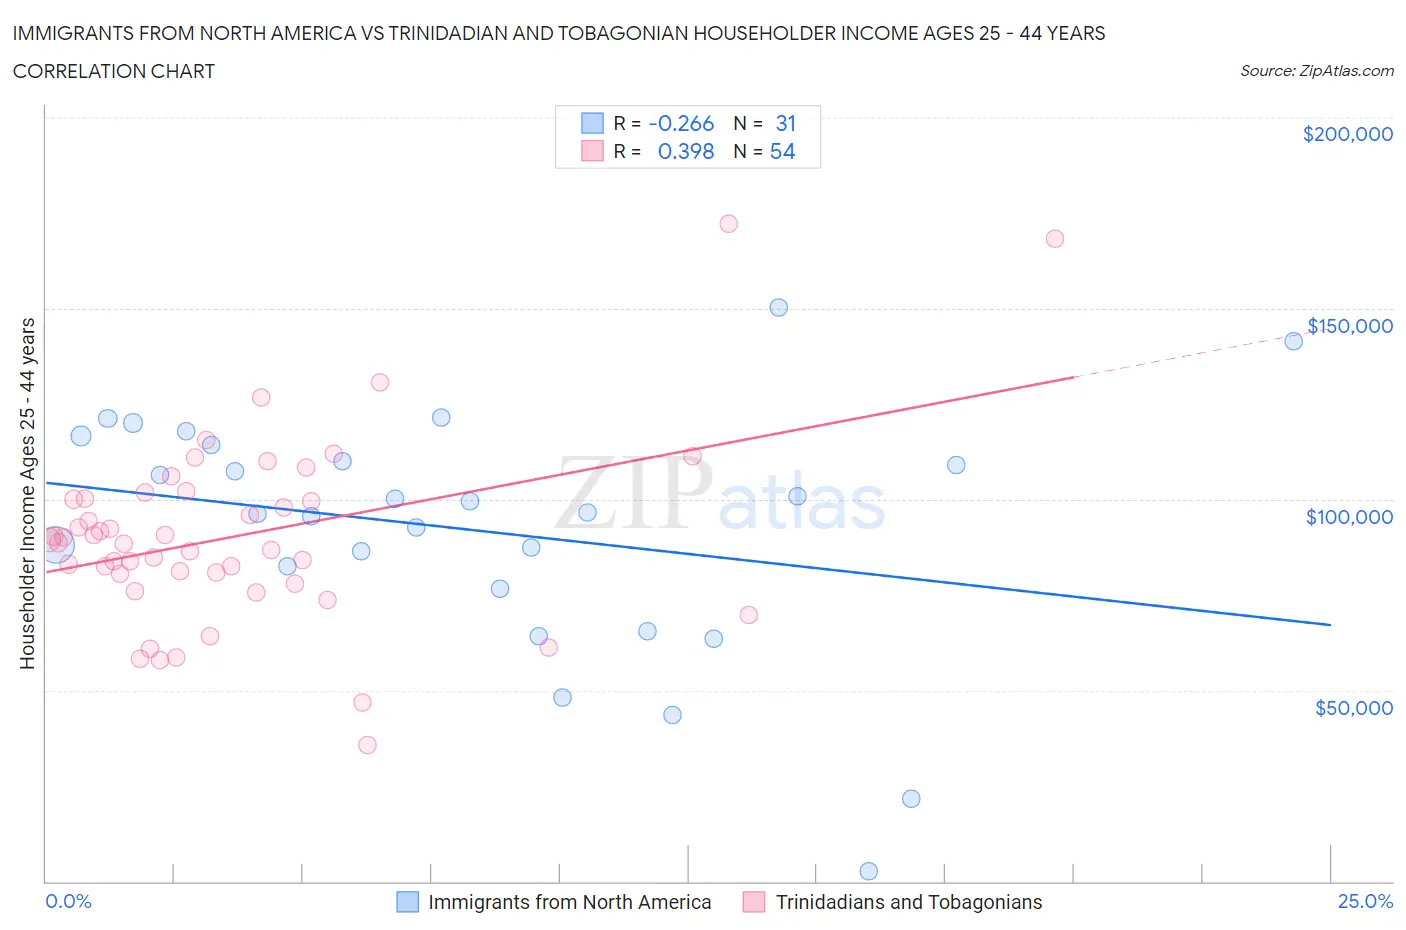
Immigrants from North America vs Trinidadian and Tobagonian Householder Income Ages 25 - 44 years Correlation Chart
The statistical analysis conducted on geographies consisting of 460,647,822 people shows a weak negative correlation between the proportion of Immigrants from North America and household income with householder between the ages 25 and 44 in the United States with a correlation coefficient (R) of -0.266 and weighted average of $102,407. Similarly, the statistical analysis conducted on geographies consisting of 219,529,863 people shows a mild positive correlation between the proportion of Trinidadians and Tobagonians and household income with householder between the ages 25 and 44 in the United States with a correlation coefficient (R) of 0.398 and weighted average of $89,856, a difference of 14.0%.
Householder Income Ages 25 - 44 years Correlation Summary
| Measurement | Immigrants from North America | Trinidadian and Tobagonian |
| Minimum | $2,499 | $35,714 |
| Maximum | $150,179 | $172,171 |
| Range | $147,680 | $136,457 |
| Mean | $91,829 | $90,466 |
| Median | $96,656 | $88,984 |
| Interquartile 25% (IQ1) | $76,535 | $80,428 |
| Interquartile 75% (IQ3) | $114,168 | $100,047 |
| Interquartile Range (IQR) | $37,632 | $19,619 |
| Standard Deviation (Sample) | $32,309 | $24,416 |
| Standard Deviation (Population) | $31,784 | $24,189 |
Similar Demographics by Householder Income Ages 25 - 44 years
Demographics Similar to Immigrants from North America by Householder Income Ages 25 - 44 years
In terms of householder income ages 25 - 44 years, the demographic groups most similar to Immigrants from North America are Croatian ($102,414, a difference of 0.010%), Ukrainian ($102,451, a difference of 0.040%), Romanian ($102,544, a difference of 0.13%), Immigrants from Canada ($102,616, a difference of 0.20%), and Immigrants from Hungary ($102,655, a difference of 0.24%).
| Demographics | Rating | Rank | Householder Income Ages 25 - 44 years |
| Immigrants | Ukraine | 98.9 /100 | #85 | Exceptional $102,664 |
| Immigrants | Hungary | 98.9 /100 | #86 | Exceptional $102,655 |
| Immigrants | Western Europe | 98.9 /100 | #87 | Exceptional $102,654 |
| Immigrants | Canada | 98.9 /100 | #88 | Exceptional $102,616 |
| Romanians | 98.8 /100 | #89 | Exceptional $102,544 |
| Ukrainians | 98.8 /100 | #90 | Exceptional $102,451 |
| Croatians | 98.7 /100 | #91 | Exceptional $102,414 |
| Immigrants | North America | 98.7 /100 | #92 | Exceptional $102,407 |
| Immigrants | England | 98.4 /100 | #93 | Exceptional $102,020 |
| Sri Lankans | 98.4 /100 | #94 | Exceptional $101,960 |
| Assyrians/Chaldeans/Syriacs | 98.3 /100 | #95 | Exceptional $101,936 |
| Macedonians | 98.3 /100 | #96 | Exceptional $101,882 |
| Austrians | 98.3 /100 | #97 | Exceptional $101,842 |
| Immigrants | Kazakhstan | 98.1 /100 | #98 | Exceptional $101,727 |
| Taiwanese | 97.9 /100 | #99 | Exceptional $101,492 |
Demographics Similar to Trinidadians and Tobagonians by Householder Income Ages 25 - 44 years
In terms of householder income ages 25 - 44 years, the demographic groups most similar to Trinidadians and Tobagonians are Delaware ($89,876, a difference of 0.020%), Guyanese ($89,940, a difference of 0.090%), Immigrants from Trinidad and Tobago ($89,748, a difference of 0.12%), Scotch-Irish ($89,969, a difference of 0.13%), and Immigrants from Ecuador ($89,673, a difference of 0.20%).
| Demographics | Rating | Rank | Householder Income Ages 25 - 44 years |
| Immigrants | Bangladesh | 9.3 /100 | #213 | Tragic $90,448 |
| Immigrants | Africa | 8.9 /100 | #214 | Tragic $90,372 |
| Panamanians | 8.1 /100 | #215 | Tragic $90,193 |
| Ghanaians | 7.9 /100 | #216 | Tragic $90,137 |
| Scotch-Irish | 7.3 /100 | #217 | Tragic $89,969 |
| Guyanese | 7.1 /100 | #218 | Tragic $89,940 |
| Delaware | 6.9 /100 | #219 | Tragic $89,876 |
| Trinidadians and Tobagonians | 6.8 /100 | #220 | Tragic $89,856 |
| Immigrants | Trinidad and Tobago | 6.5 /100 | #221 | Tragic $89,748 |
| Immigrants | Ecuador | 6.2 /100 | #222 | Tragic $89,673 |
| Immigrants | Guyana | 5.9 /100 | #223 | Tragic $89,586 |
| Barbadians | 5.9 /100 | #224 | Tragic $89,565 |
| Immigrants | Panama | 5.5 /100 | #225 | Tragic $89,451 |
| Immigrants | Iraq | 5.5 /100 | #226 | Tragic $89,444 |
| Immigrants | St. Vincent and the Grenadines | 4.1 /100 | #227 | Tragic $88,888 |