Immigrants from Nigeria vs Hmong 4 or more Vehicles in Household
COMPARE
Immigrants from Nigeria
Hmong
4 or more Vehicles in Household
4 or more Vehicles in Household Comparison
Immigrants from Nigeria
Hmong
6.1%
4 OR MORE VEHICLES IN HOUSEHOLD
15.6/ 100
METRIC RATING
208th/ 347
METRIC RANK
7.0%
4 OR MORE VEHICLES IN HOUSEHOLD
98.3/ 100
METRIC RATING
104th/ 347
METRIC RANK
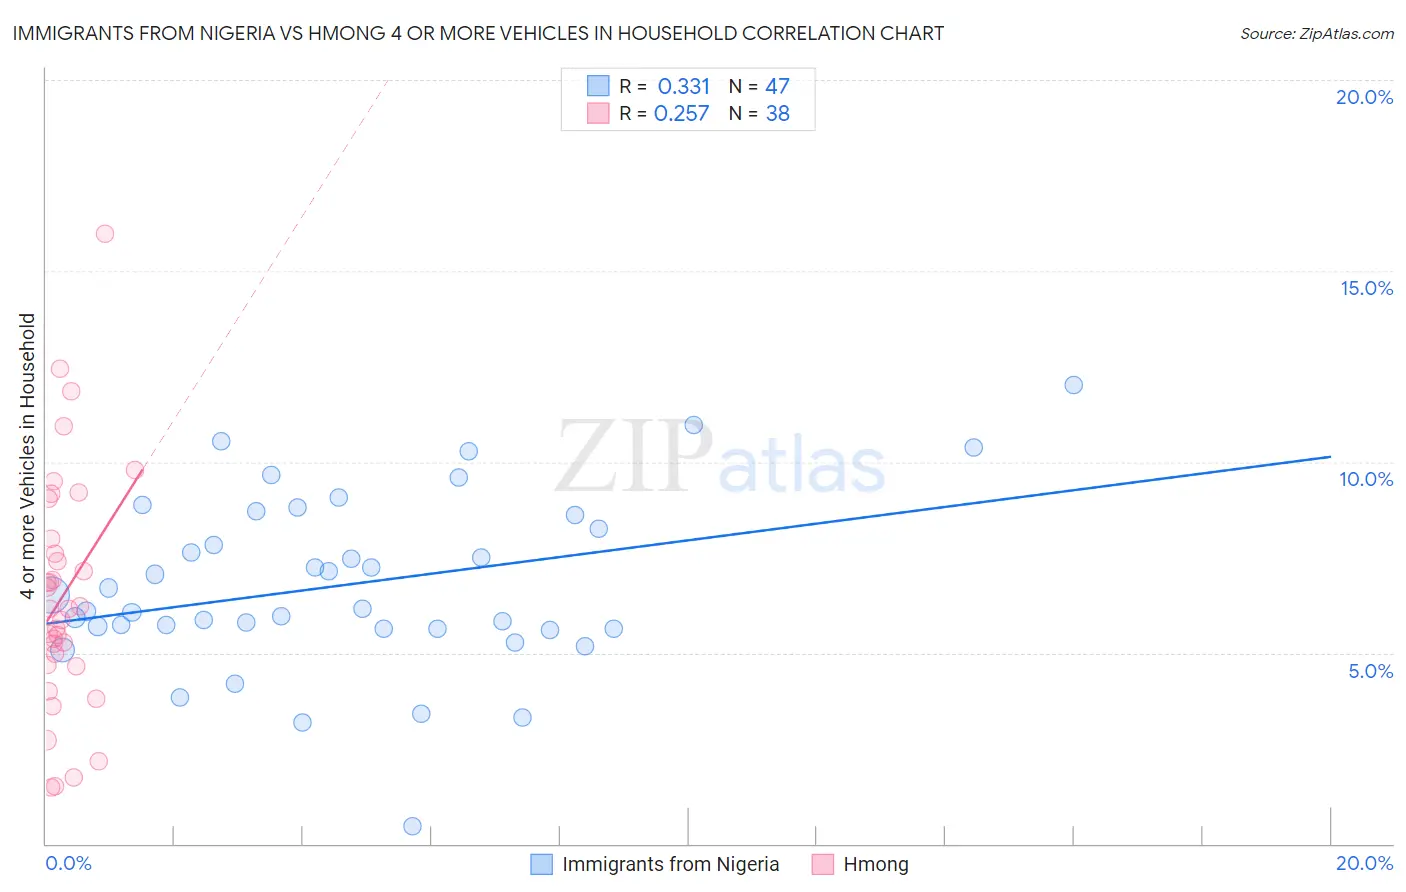
Immigrants from Nigeria vs Hmong 4 or more Vehicles in Household Correlation Chart
The statistical analysis conducted on geographies consisting of 282,190,677 people shows a mild positive correlation between the proportion of Immigrants from Nigeria and percentage of households with 4 or more vehicles available in the United States with a correlation coefficient (R) of 0.331 and weighted average of 6.1%. Similarly, the statistical analysis conducted on geographies consisting of 24,663,855 people shows a weak positive correlation between the proportion of Hmong and percentage of households with 4 or more vehicles available in the United States with a correlation coefficient (R) of 0.257 and weighted average of 7.0%, a difference of 15.2%.
4 or more Vehicles in Household Correlation Summary
| Measurement | Immigrants from Nigeria | Hmong |
| Minimum | 0.47% | 1.5% |
| Maximum | 12.0% | 16.0% |
| Range | 11.5% | 14.5% |
| Mean | 6.8% | 6.5% |
| Median | 6.2% | 6.1% |
| Interquartile 25% (IQ1) | 5.6% | 4.7% |
| Interquartile 75% (IQ3) | 8.6% | 8.0% |
| Interquartile Range (IQR) | 3.0% | 3.3% |
| Standard Deviation (Sample) | 2.3% | 3.1% |
| Standard Deviation (Population) | 2.3% | 3.1% |
Similar Demographics by 4 or more Vehicles in Household
Demographics Similar to Immigrants from Nigeria by 4 or more Vehicles in Household
In terms of 4 or more vehicles in household, the demographic groups most similar to Immigrants from Nigeria are Immigrants from Honduras (6.1%, a difference of 0.030%), Immigrants from Zimbabwe (6.0%, a difference of 0.090%), Panamanian (6.0%, a difference of 0.17%), Immigrants from Egypt (6.0%, a difference of 0.18%), and Arab (6.0%, a difference of 0.24%).
| Demographics | Rating | Rank | 4 or more Vehicles in Household |
| Egyptians | 21.4 /100 | #201 | Fair 6.1% |
| Immigrants | South Central Asia | 21.3 /100 | #202 | Fair 6.1% |
| Immigrants | Sierra Leone | 20.5 /100 | #203 | Fair 6.1% |
| Immigrants | Belize | 19.8 /100 | #204 | Poor 6.1% |
| Hondurans | 19.3 /100 | #205 | Poor 6.1% |
| Kenyans | 18.5 /100 | #206 | Poor 6.1% |
| Immigrants | Chile | 16.9 /100 | #207 | Poor 6.1% |
| Immigrants | Nigeria | 15.6 /100 | #208 | Poor 6.1% |
| Immigrants | Honduras | 15.4 /100 | #209 | Poor 6.1% |
| Immigrants | Zimbabwe | 15.1 /100 | #210 | Poor 6.0% |
| Panamanians | 14.8 /100 | #211 | Poor 6.0% |
| Immigrants | Egypt | 14.7 /100 | #212 | Poor 6.0% |
| Arabs | 14.4 /100 | #213 | Poor 6.0% |
| Immigrants | Austria | 14.3 /100 | #214 | Poor 6.0% |
| Immigrants | China | 13.8 /100 | #215 | Poor 6.0% |
Demographics Similar to Hmong by 4 or more Vehicles in Household
In terms of 4 or more vehicles in household, the demographic groups most similar to Hmong are German Russian (7.0%, a difference of 0.0%), Guatemalan (7.0%, a difference of 0.35%), Nicaraguan (7.0%, a difference of 0.36%), Blackfeet (7.0%, a difference of 0.48%), and Asian (7.0%, a difference of 0.49%).
| Demographics | Rating | Rank | 4 or more Vehicles in Household |
| Celtics | 99.1 /100 | #97 | Exceptional 7.1% |
| Irish | 99.0 /100 | #98 | Exceptional 7.1% |
| Seminole | 98.8 /100 | #99 | Exceptional 7.0% |
| Taiwanese | 98.7 /100 | #100 | Exceptional 7.0% |
| Pakistanis | 98.7 /100 | #101 | Exceptional 7.0% |
| Asians | 98.6 /100 | #102 | Exceptional 7.0% |
| Blackfeet | 98.6 /100 | #103 | Exceptional 7.0% |
| Hmong | 98.3 /100 | #104 | Exceptional 7.0% |
| German Russians | 98.3 /100 | #105 | Exceptional 7.0% |
| Guatemalans | 98.1 /100 | #106 | Exceptional 7.0% |
| Nicaraguans | 98.0 /100 | #107 | Exceptional 7.0% |
| French | 97.7 /100 | #108 | Exceptional 6.9% |
| Filipinos | 97.6 /100 | #109 | Exceptional 6.9% |
| Immigrants | Thailand | 97.0 /100 | #110 | Exceptional 6.9% |
| Aleuts | 97.0 /100 | #111 | Exceptional 6.9% |