Immigrants from Nigeria vs Hmong Single Mother Households
COMPARE
Immigrants from Nigeria
Hmong
Single Mother Households
Single Mother Households Comparison
Immigrants from Nigeria
Hmong
7.8%
SINGLE MOTHER HOUSEHOLDS
0.0/ 100
METRIC RATING
290th/ 347
METRIC RANK
6.4%
SINGLE MOTHER HOUSEHOLDS
39.8/ 100
METRIC RATING
179th/ 347
METRIC RANK
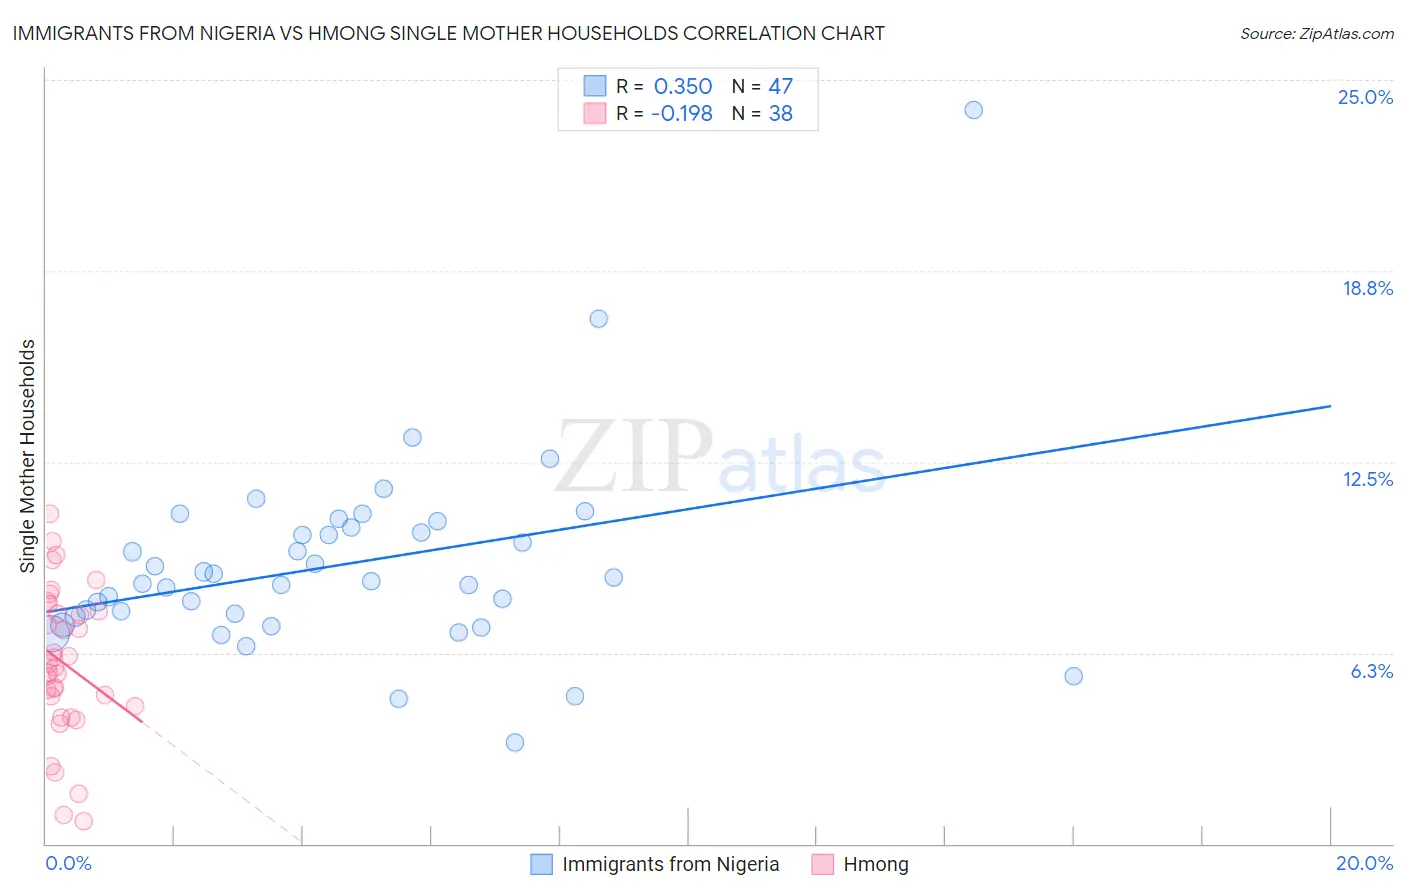
Immigrants from Nigeria vs Hmong Single Mother Households Correlation Chart
The statistical analysis conducted on geographies consisting of 283,117,346 people shows a mild positive correlation between the proportion of Immigrants from Nigeria and percentage of single mother households in the United States with a correlation coefficient (R) of 0.350 and weighted average of 7.8%. Similarly, the statistical analysis conducted on geographies consisting of 24,669,739 people shows a poor negative correlation between the proportion of Hmong and percentage of single mother households in the United States with a correlation coefficient (R) of -0.198 and weighted average of 6.4%, a difference of 22.8%.
Single Mother Households Correlation Summary
| Measurement | Immigrants from Nigeria | Hmong |
| Minimum | 3.3% | 0.72% |
| Maximum | 24.0% | 10.8% |
| Range | 20.7% | 10.1% |
| Mean | 9.1% | 5.9% |
| Median | 8.6% | 5.8% |
| Interquartile 25% (IQ1) | 7.4% | 4.5% |
| Interquartile 75% (IQ3) | 10.4% | 7.6% |
| Interquartile Range (IQR) | 2.9% | 3.1% |
| Standard Deviation (Sample) | 3.2% | 2.4% |
| Standard Deviation (Population) | 3.2% | 2.4% |
Similar Demographics by Single Mother Households
Demographics Similar to Immigrants from Nigeria by Single Mother Households
In terms of single mother households, the demographic groups most similar to Immigrants from Nigeria are West Indian (7.8%, a difference of 0.080%), Ghanaian (7.8%, a difference of 0.090%), Subsaharan African (7.8%, a difference of 0.42%), Immigrants from Cameroon (7.9%, a difference of 0.45%), and Apache (7.9%, a difference of 0.55%).
| Demographics | Rating | Rank | Single Mother Households |
| Nigerians | 0.0 /100 | #283 | Tragic 7.7% |
| Immigrants | Belize | 0.0 /100 | #284 | Tragic 7.7% |
| Trinidadians and Tobagonians | 0.0 /100 | #285 | Tragic 7.7% |
| Immigrants | Middle Africa | 0.0 /100 | #286 | Tragic 7.7% |
| Immigrants | Guatemala | 0.0 /100 | #287 | Tragic 7.7% |
| Sierra Leoneans | 0.0 /100 | #288 | Tragic 7.7% |
| Sub-Saharan Africans | 0.0 /100 | #289 | Tragic 7.8% |
| Immigrants | Nigeria | 0.0 /100 | #290 | Tragic 7.8% |
| West Indians | 0.0 /100 | #291 | Tragic 7.8% |
| Ghanaians | 0.0 /100 | #292 | Tragic 7.8% |
| Immigrants | Cameroon | 0.0 /100 | #293 | Tragic 7.9% |
| Apache | 0.0 /100 | #294 | Tragic 7.9% |
| Barbadians | 0.0 /100 | #295 | Tragic 7.9% |
| Immigrants | Latin America | 0.0 /100 | #296 | Tragic 7.9% |
| Hispanics or Latinos | 0.0 /100 | #297 | Tragic 7.9% |
Demographics Similar to Hmong by Single Mother Households
In terms of single mother households, the demographic groups most similar to Hmong are Portuguese (6.4%, a difference of 0.020%), Osage (6.4%, a difference of 0.36%), Immigrants from Nepal (6.4%, a difference of 0.43%), Immigrants from Bosnia and Herzegovina (6.3%, a difference of 0.51%), and Marshallese (6.3%, a difference of 0.67%).
| Demographics | Rating | Rank | Single Mother Households |
| Immigrants | South Eastern Asia | 52.2 /100 | #172 | Average 6.3% |
| Immigrants | Vietnam | 51.5 /100 | #173 | Average 6.3% |
| Immigrants | Morocco | 50.0 /100 | #174 | Average 6.3% |
| Marshallese | 45.8 /100 | #175 | Average 6.3% |
| Immigrants | Bosnia and Herzegovina | 44.3 /100 | #176 | Average 6.3% |
| Osage | 43.0 /100 | #177 | Average 6.4% |
| Portuguese | 40.0 /100 | #178 | Fair 6.4% |
| Hmong | 39.8 /100 | #179 | Fair 6.4% |
| Immigrants | Nepal | 36.1 /100 | #180 | Fair 6.4% |
| Spanish | 33.4 /100 | #181 | Fair 6.4% |
| South American Indians | 33.4 /100 | #182 | Fair 6.4% |
| Spaniards | 27.8 /100 | #183 | Fair 6.5% |
| Ethiopians | 26.0 /100 | #184 | Fair 6.5% |
| Ugandans | 25.6 /100 | #185 | Fair 6.5% |
| Costa Ricans | 24.8 /100 | #186 | Fair 6.5% |