Czechoslovakian vs Hmong 4 or more Vehicles in Household
COMPARE
Czechoslovakian
Hmong
4 or more Vehicles in Household
4 or more Vehicles in Household Comparison
Czechoslovakians
Hmong
7.1%
4 OR MORE VEHICLES IN HOUSEHOLD
99.3/ 100
METRIC RATING
95th/ 347
METRIC RANK
7.0%
4 OR MORE VEHICLES IN HOUSEHOLD
98.3/ 100
METRIC RATING
104th/ 347
METRIC RANK
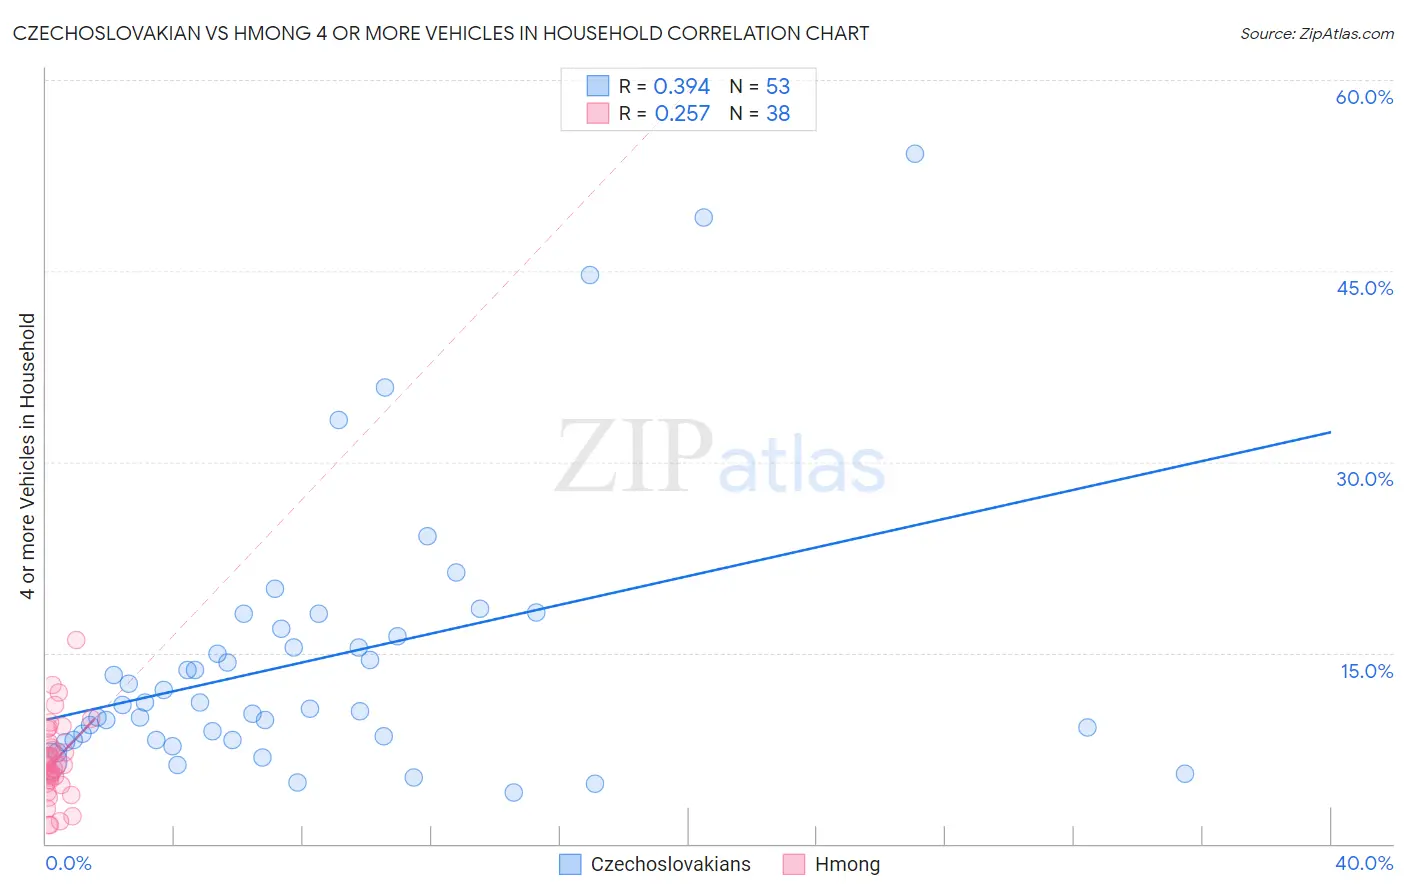
Czechoslovakian vs Hmong 4 or more Vehicles in Household Correlation Chart
The statistical analysis conducted on geographies consisting of 367,717,955 people shows a mild positive correlation between the proportion of Czechoslovakians and percentage of households with 4 or more vehicles available in the United States with a correlation coefficient (R) of 0.394 and weighted average of 7.1%. Similarly, the statistical analysis conducted on geographies consisting of 24,663,855 people shows a weak positive correlation between the proportion of Hmong and percentage of households with 4 or more vehicles available in the United States with a correlation coefficient (R) of 0.257 and weighted average of 7.0%, a difference of 1.9%.
4 or more Vehicles in Household Correlation Summary
| Measurement | Czechoslovakian | Hmong |
| Minimum | 4.1% | 1.5% |
| Maximum | 54.2% | 16.0% |
| Range | 50.1% | 14.5% |
| Mean | 14.5% | 6.5% |
| Median | 10.9% | 6.1% |
| Interquartile 25% (IQ1) | 8.2% | 4.7% |
| Interquartile 75% (IQ3) | 16.6% | 8.0% |
| Interquartile Range (IQR) | 8.4% | 3.3% |
| Standard Deviation (Sample) | 10.7% | 3.1% |
| Standard Deviation (Population) | 10.6% | 3.1% |
Demographics Similar to Czechoslovakians and Hmong by 4 or more Vehicles in Household
In terms of 4 or more vehicles in household, the demographic groups most similar to Czechoslovakians are Central American (7.1%, a difference of 0.010%), Dutch West Indian (7.1%, a difference of 0.21%), Immigrants from Afghanistan (7.1%, a difference of 0.22%), Celtic (7.1%, a difference of 0.37%), and Immigrants from Latin America (7.1%, a difference of 0.39%). Similarly, the demographic groups most similar to Hmong are German Russian (7.0%, a difference of 0.0%), Guatemalan (7.0%, a difference of 0.35%), Nicaraguan (7.0%, a difference of 0.36%), Blackfeet (7.0%, a difference of 0.48%), and Asian (7.0%, a difference of 0.49%).
| Demographics | Rating | Rank | 4 or more Vehicles in Household |
| British | 99.6 /100 | #89 | Exceptional 7.2% |
| Creek | 99.6 /100 | #90 | Exceptional 7.2% |
| Assyrians/Chaldeans/Syriacs | 99.4 /100 | #91 | Exceptional 7.2% |
| Immigrants | Latin America | 99.4 /100 | #92 | Exceptional 7.1% |
| Immigrants | Afghanistan | 99.3 /100 | #93 | Exceptional 7.1% |
| Dutch West Indians | 99.3 /100 | #94 | Exceptional 7.1% |
| Czechoslovakians | 99.3 /100 | #95 | Exceptional 7.1% |
| Central Americans | 99.3 /100 | #96 | Exceptional 7.1% |
| Celtics | 99.1 /100 | #97 | Exceptional 7.1% |
| Irish | 99.0 /100 | #98 | Exceptional 7.1% |
| Seminole | 98.8 /100 | #99 | Exceptional 7.0% |
| Taiwanese | 98.7 /100 | #100 | Exceptional 7.0% |
| Pakistanis | 98.7 /100 | #101 | Exceptional 7.0% |
| Asians | 98.6 /100 | #102 | Exceptional 7.0% |
| Blackfeet | 98.6 /100 | #103 | Exceptional 7.0% |
| Hmong | 98.3 /100 | #104 | Exceptional 7.0% |
| German Russians | 98.3 /100 | #105 | Exceptional 7.0% |
| Guatemalans | 98.1 /100 | #106 | Exceptional 7.0% |
| Nicaraguans | 98.0 /100 | #107 | Exceptional 7.0% |
| French | 97.7 /100 | #108 | Exceptional 6.9% |
| Filipinos | 97.6 /100 | #109 | Exceptional 6.9% |