Immigrants from Nigeria vs Hmong In Labor Force | Age 25-29
COMPARE
Immigrants from Nigeria
Hmong
In Labor Force | Age 25-29
In Labor Force | Age 25-29 Comparison
Immigrants from Nigeria
Hmong
84.3%
IN LABOR FORCE | AGE 25-29
9.0/ 100
METRIC RATING
218th/ 347
METRIC RANK
83.7%
IN LABOR FORCE | AGE 25-29
0.3/ 100
METRIC RATING
249th/ 347
METRIC RANK
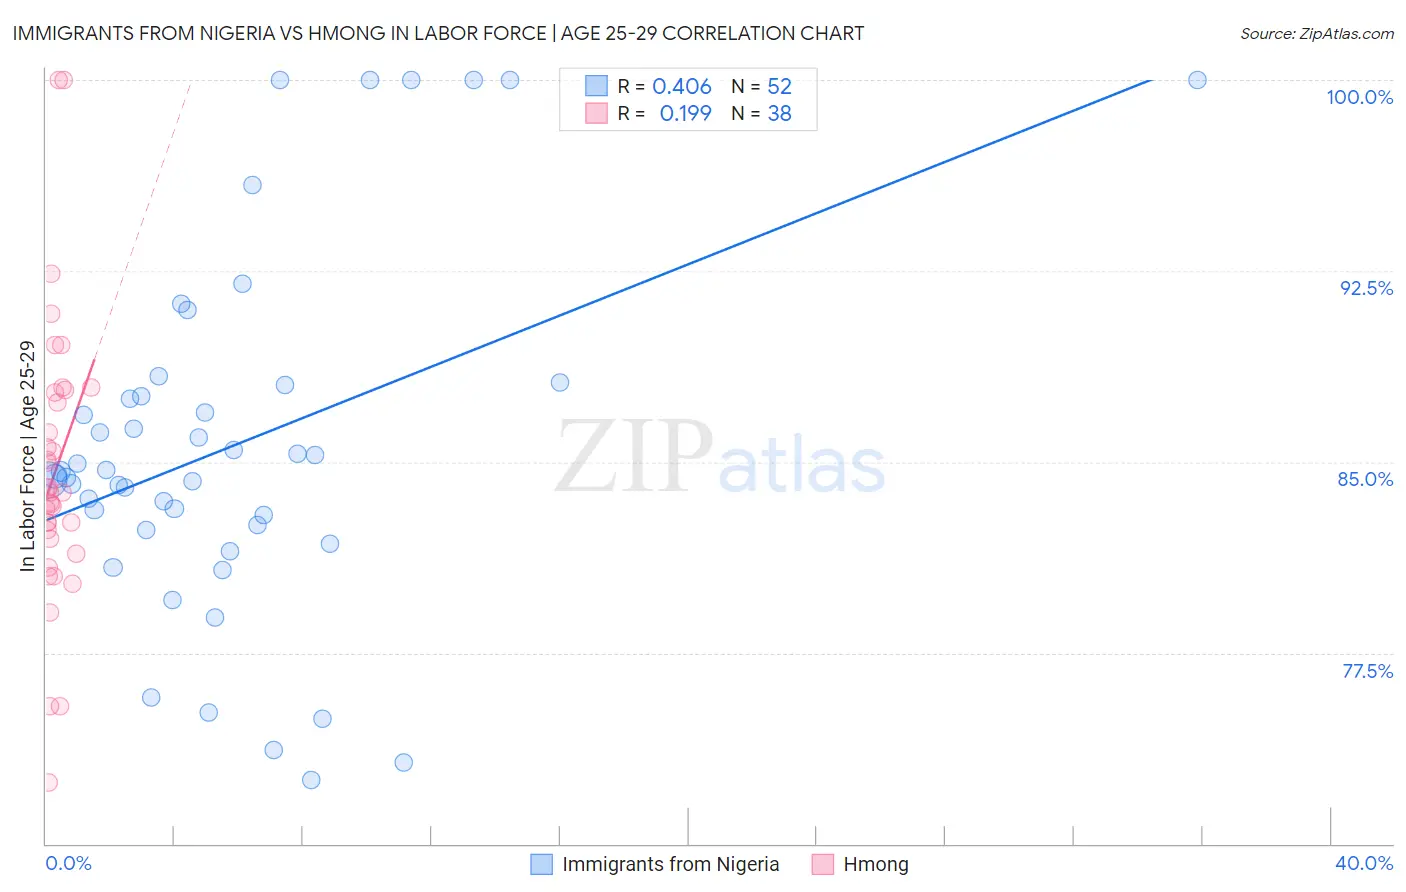
Immigrants from Nigeria vs Hmong In Labor Force | Age 25-29 Correlation Chart
The statistical analysis conducted on geographies consisting of 283,439,551 people shows a moderate positive correlation between the proportion of Immigrants from Nigeria and labor force participation rate among population between the ages 25 and 29 in the United States with a correlation coefficient (R) of 0.406 and weighted average of 84.3%. Similarly, the statistical analysis conducted on geographies consisting of 24,664,732 people shows a poor positive correlation between the proportion of Hmong and labor force participation rate among population between the ages 25 and 29 in the United States with a correlation coefficient (R) of 0.199 and weighted average of 83.7%, a difference of 0.68%.
In Labor Force | Age 25-29 Correlation Summary
| Measurement | Immigrants from Nigeria | Hmong |
| Minimum | 72.5% | 72.4% |
| Maximum | 100.0% | 100.0% |
| Range | 27.5% | 27.6% |
| Mean | 85.6% | 84.6% |
| Median | 84.5% | 83.8% |
| Interquartile 25% (IQ1) | 82.4% | 82.0% |
| Interquartile 75% (IQ3) | 87.8% | 87.7% |
| Interquartile Range (IQR) | 5.4% | 5.7% |
| Standard Deviation (Sample) | 7.0% | 5.5% |
| Standard Deviation (Population) | 6.9% | 5.5% |
Similar Demographics by In Labor Force | Age 25-29
Demographics Similar to Immigrants from Nigeria by In Labor Force | Age 25-29
In terms of in labor force | age 25-29, the demographic groups most similar to Immigrants from Nigeria are Immigrants from Saudi Arabia (84.3%, a difference of 0.0%), Israeli (84.3%, a difference of 0.010%), Immigrants from Ecuador (84.3%, a difference of 0.010%), Lebanese (84.3%, a difference of 0.040%), and Immigrants from Syria (84.3%, a difference of 0.040%).
| Demographics | Rating | Rank | In Labor Force | Age 25-29 |
| Immigrants | Venezuela | 12.6 /100 | #211 | Poor 84.3% |
| Sub-Saharan Africans | 11.7 /100 | #212 | Poor 84.3% |
| Japanese | 11.4 /100 | #213 | Poor 84.3% |
| Lebanese | 11.1 /100 | #214 | Poor 84.3% |
| Immigrants | Syria | 10.7 /100 | #215 | Poor 84.3% |
| Israelis | 9.3 /100 | #216 | Tragic 84.3% |
| Immigrants | Ecuador | 9.3 /100 | #217 | Tragic 84.3% |
| Immigrants | Nigeria | 9.0 /100 | #218 | Tragic 84.3% |
| Immigrants | Saudi Arabia | 8.8 /100 | #219 | Tragic 84.3% |
| Nigerians | 7.2 /100 | #220 | Tragic 84.3% |
| Arabs | 6.8 /100 | #221 | Tragic 84.2% |
| Jordanians | 6.7 /100 | #222 | Tragic 84.2% |
| Scotch-Irish | 6.5 /100 | #223 | Tragic 84.2% |
| Immigrants | West Indies | 6.0 /100 | #224 | Tragic 84.2% |
| Koreans | 5.9 /100 | #225 | Tragic 84.2% |
Demographics Similar to Hmong by In Labor Force | Age 25-29
In terms of in labor force | age 25-29, the demographic groups most similar to Hmong are Nonimmigrants (83.7%, a difference of 0.010%), Central American (83.7%, a difference of 0.020%), Immigrants from El Salvador (83.7%, a difference of 0.030%), Bahamian (83.7%, a difference of 0.030%), and Cree (83.8%, a difference of 0.040%).
| Demographics | Rating | Rank | In Labor Force | Age 25-29 |
| U.S. Virgin Islanders | 0.6 /100 | #242 | Tragic 83.8% |
| Salvadorans | 0.5 /100 | #243 | Tragic 83.8% |
| Immigrants | Jamaica | 0.4 /100 | #244 | Tragic 83.8% |
| Iroquois | 0.4 /100 | #245 | Tragic 83.8% |
| Cree | 0.3 /100 | #246 | Tragic 83.8% |
| Immigrants | El Salvador | 0.3 /100 | #247 | Tragic 83.7% |
| Immigrants | Nonimmigrants | 0.3 /100 | #248 | Tragic 83.7% |
| Hmong | 0.3 /100 | #249 | Tragic 83.7% |
| Central Americans | 0.2 /100 | #250 | Tragic 83.7% |
| Bahamians | 0.2 /100 | #251 | Tragic 83.7% |
| Guatemalans | 0.2 /100 | #252 | Tragic 83.7% |
| Immigrants | Trinidad and Tobago | 0.2 /100 | #253 | Tragic 83.7% |
| Spaniards | 0.2 /100 | #254 | Tragic 83.7% |
| Haitians | 0.2 /100 | #255 | Tragic 83.7% |
| Immigrants | Haiti | 0.2 /100 | #256 | Tragic 83.7% |