Immigrants from Nigeria vs Cape Verdean 4 or more Vehicles in Household
COMPARE
Immigrants from Nigeria
Cape Verdean
4 or more Vehicles in Household
4 or more Vehicles in Household Comparison
Immigrants from Nigeria
Cape Verdeans
6.1%
4 OR MORE VEHICLES IN HOUSEHOLD
15.6/ 100
METRIC RATING
208th/ 347
METRIC RANK
4.4%
4 OR MORE VEHICLES IN HOUSEHOLD
0.0/ 100
METRIC RATING
326th/ 347
METRIC RANK
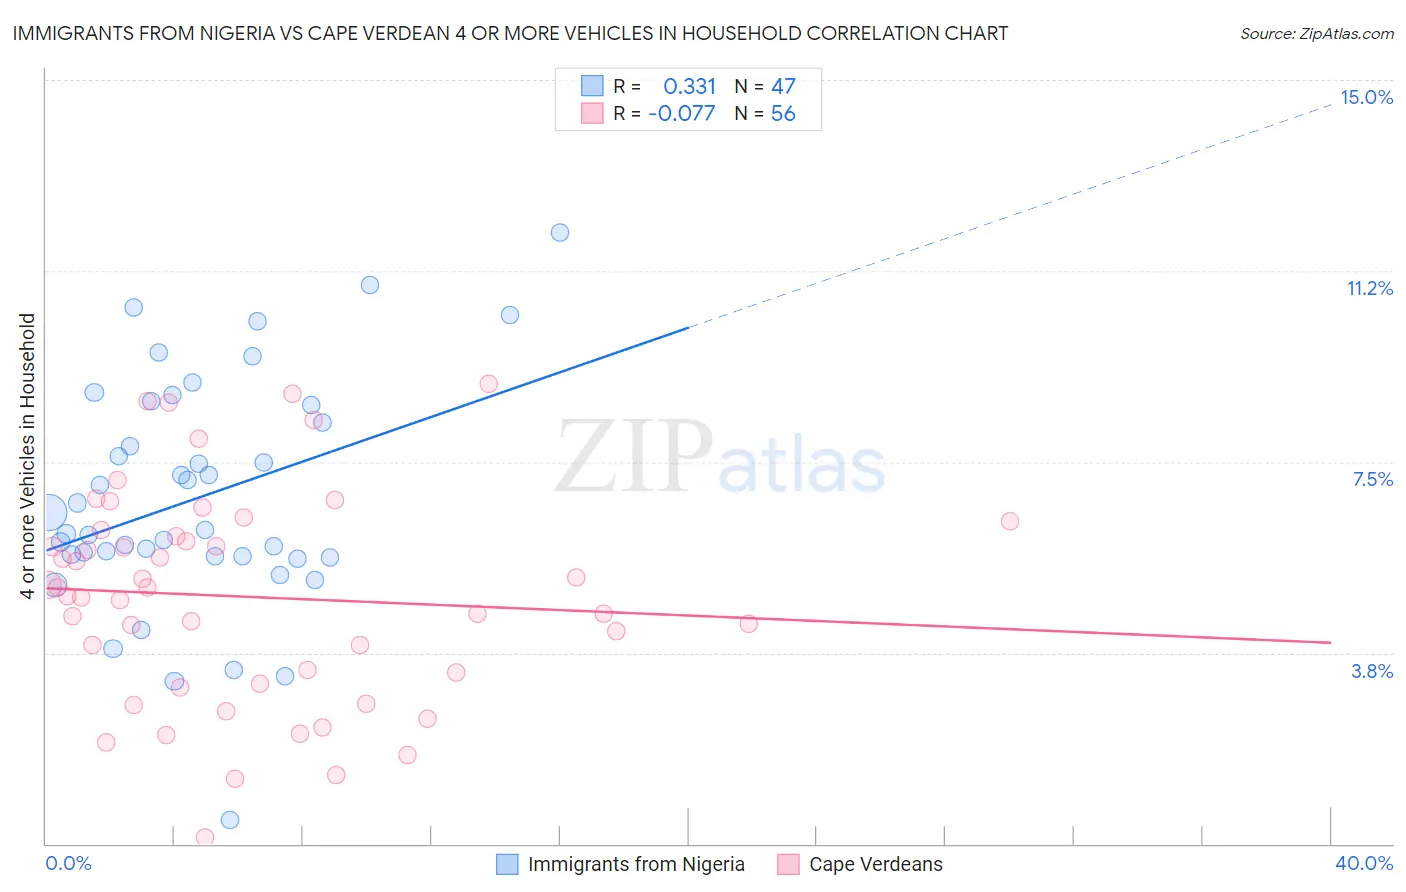
Immigrants from Nigeria vs Cape Verdean 4 or more Vehicles in Household Correlation Chart
The statistical analysis conducted on geographies consisting of 282,190,677 people shows a mild positive correlation between the proportion of Immigrants from Nigeria and percentage of households with 4 or more vehicles available in the United States with a correlation coefficient (R) of 0.331 and weighted average of 6.1%. Similarly, the statistical analysis conducted on geographies consisting of 107,262,408 people shows a slight negative correlation between the proportion of Cape Verdeans and percentage of households with 4 or more vehicles available in the United States with a correlation coefficient (R) of -0.077 and weighted average of 4.4%, a difference of 37.7%.
4 or more Vehicles in Household Correlation Summary
| Measurement | Immigrants from Nigeria | Cape Verdean |
| Minimum | 0.47% | 0.12% |
| Maximum | 12.0% | 9.0% |
| Range | 11.5% | 8.9% |
| Mean | 6.8% | 4.8% |
| Median | 6.2% | 4.9% |
| Interquartile 25% (IQ1) | 5.6% | 3.2% |
| Interquartile 75% (IQ3) | 8.6% | 6.1% |
| Interquartile Range (IQR) | 3.0% | 2.8% |
| Standard Deviation (Sample) | 2.3% | 2.1% |
| Standard Deviation (Population) | 2.3% | 2.1% |
Similar Demographics by 4 or more Vehicles in Household
Demographics Similar to Immigrants from Nigeria by 4 or more Vehicles in Household
In terms of 4 or more vehicles in household, the demographic groups most similar to Immigrants from Nigeria are Immigrants from Honduras (6.1%, a difference of 0.030%), Immigrants from Zimbabwe (6.0%, a difference of 0.090%), Panamanian (6.0%, a difference of 0.17%), Immigrants from Egypt (6.0%, a difference of 0.18%), and Arab (6.0%, a difference of 0.24%).
| Demographics | Rating | Rank | 4 or more Vehicles in Household |
| Egyptians | 21.4 /100 | #201 | Fair 6.1% |
| Immigrants | South Central Asia | 21.3 /100 | #202 | Fair 6.1% |
| Immigrants | Sierra Leone | 20.5 /100 | #203 | Fair 6.1% |
| Immigrants | Belize | 19.8 /100 | #204 | Poor 6.1% |
| Hondurans | 19.3 /100 | #205 | Poor 6.1% |
| Kenyans | 18.5 /100 | #206 | Poor 6.1% |
| Immigrants | Chile | 16.9 /100 | #207 | Poor 6.1% |
| Immigrants | Nigeria | 15.6 /100 | #208 | Poor 6.1% |
| Immigrants | Honduras | 15.4 /100 | #209 | Poor 6.1% |
| Immigrants | Zimbabwe | 15.1 /100 | #210 | Poor 6.0% |
| Panamanians | 14.8 /100 | #211 | Poor 6.0% |
| Immigrants | Egypt | 14.7 /100 | #212 | Poor 6.0% |
| Arabs | 14.4 /100 | #213 | Poor 6.0% |
| Immigrants | Austria | 14.3 /100 | #214 | Poor 6.0% |
| Immigrants | China | 13.8 /100 | #215 | Poor 6.0% |
Demographics Similar to Cape Verdeans by 4 or more Vehicles in Household
In terms of 4 or more vehicles in household, the demographic groups most similar to Cape Verdeans are Immigrants from Jamaica (4.4%, a difference of 0.32%), Soviet Union (4.4%, a difference of 0.64%), Immigrants from Caribbean (4.4%, a difference of 0.92%), Immigrants from Yemen (4.5%, a difference of 1.3%), and Ecuadorian (4.5%, a difference of 1.5%).
| Demographics | Rating | Rank | 4 or more Vehicles in Household |
| Haitians | 0.0 /100 | #319 | Tragic 4.6% |
| Immigrants | Haiti | 0.0 /100 | #320 | Tragic 4.5% |
| Ecuadorians | 0.0 /100 | #321 | Tragic 4.5% |
| Immigrants | Yemen | 0.0 /100 | #322 | Tragic 4.5% |
| Immigrants | Caribbean | 0.0 /100 | #323 | Tragic 4.4% |
| Soviet Union | 0.0 /100 | #324 | Tragic 4.4% |
| Immigrants | Jamaica | 0.0 /100 | #325 | Tragic 4.4% |
| Cape Verdeans | 0.0 /100 | #326 | Tragic 4.4% |
| Senegalese | 0.0 /100 | #327 | Tragic 4.3% |
| Trinidadians and Tobagonians | 0.0 /100 | #328 | Tragic 4.3% |
| Immigrants | Senegal | 0.0 /100 | #329 | Tragic 4.2% |
| Immigrants | Ecuador | 0.0 /100 | #330 | Tragic 4.2% |
| West Indians | 0.0 /100 | #331 | Tragic 4.2% |
| Immigrants | Dominica | 0.0 /100 | #332 | Tragic 4.2% |
| Immigrants | Albania | 0.0 /100 | #333 | Tragic 4.1% |