Immigrants from Moldova vs Native/Alaskan Householder Income Ages 25 - 44 years
COMPARE
Immigrants from Moldova
Native/Alaskan
Householder Income Ages 25 - 44 years
Householder Income Ages 25 - 44 years Comparison
Immigrants from Moldova
Natives/Alaskans
$101,091
HOUSEHOLDER INCOME AGES 25 - 44 YEARS
97.4/ 100
METRIC RATING
103rd/ 347
METRIC RANK
$75,647
HOUSEHOLDER INCOME AGES 25 - 44 YEARS
0.0/ 100
METRIC RATING
331st/ 347
METRIC RANK
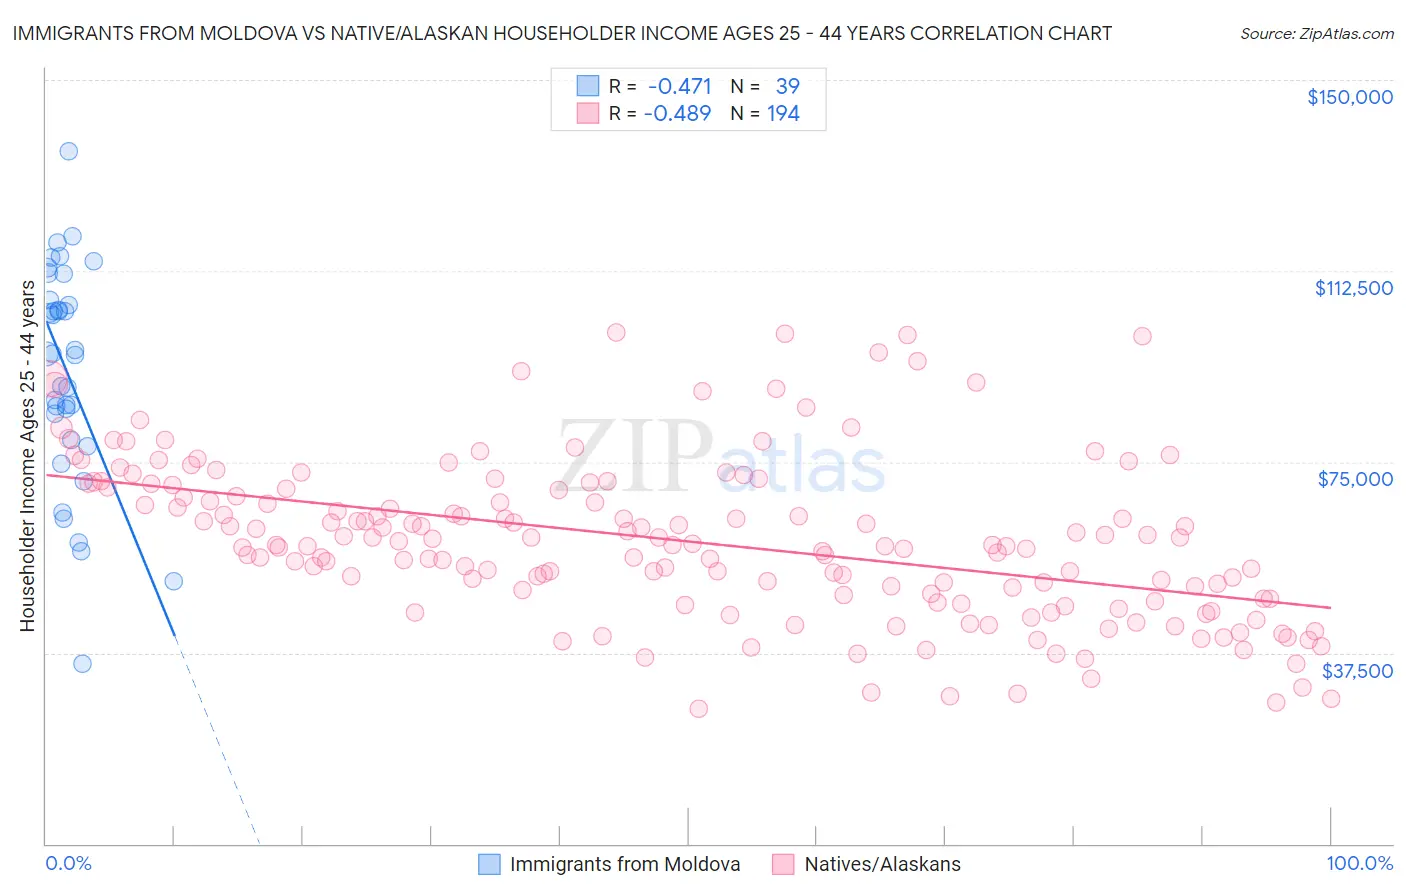
Immigrants from Moldova vs Native/Alaskan Householder Income Ages 25 - 44 years Correlation Chart
The statistical analysis conducted on geographies consisting of 124,290,289 people shows a moderate negative correlation between the proportion of Immigrants from Moldova and household income with householder between the ages 25 and 44 in the United States with a correlation coefficient (R) of -0.471 and weighted average of $101,091. Similarly, the statistical analysis conducted on geographies consisting of 509,973,002 people shows a moderate negative correlation between the proportion of Natives/Alaskans and household income with householder between the ages 25 and 44 in the United States with a correlation coefficient (R) of -0.489 and weighted average of $75,647, a difference of 33.6%.
Householder Income Ages 25 - 44 years Correlation Summary
| Measurement | Immigrants from Moldova | Native/Alaskan |
| Minimum | $35,313 | $26,585 |
| Maximum | $136,071 | $100,355 |
| Range | $100,758 | $73,770 |
| Mean | $92,583 | $59,417 |
| Median | $96,188 | $58,652 |
| Interquartile 25% (IQ1) | $79,269 | $48,151 |
| Interquartile 75% (IQ3) | $106,700 | $69,627 |
| Interquartile Range (IQR) | $27,431 | $21,476 |
| Standard Deviation (Sample) | $21,518 | $15,647 |
| Standard Deviation (Population) | $21,240 | $15,607 |
Similar Demographics by Householder Income Ages 25 - 44 years
Demographics Similar to Immigrants from Moldova by Householder Income Ages 25 - 44 years
In terms of householder income ages 25 - 44 years, the demographic groups most similar to Immigrants from Moldova are Immigrants from Lebanon ($101,124, a difference of 0.030%), Immigrants from Poland ($101,065, a difference of 0.030%), Albanian ($101,367, a difference of 0.27%), Immigrants from Argentina ($101,415, a difference of 0.32%), and Taiwanese ($101,492, a difference of 0.40%).
| Demographics | Rating | Rank | Householder Income Ages 25 - 44 years |
| Macedonians | 98.3 /100 | #96 | Exceptional $101,882 |
| Austrians | 98.3 /100 | #97 | Exceptional $101,842 |
| Immigrants | Kazakhstan | 98.1 /100 | #98 | Exceptional $101,727 |
| Taiwanese | 97.9 /100 | #99 | Exceptional $101,492 |
| Immigrants | Argentina | 97.8 /100 | #100 | Exceptional $101,415 |
| Albanians | 97.8 /100 | #101 | Exceptional $101,367 |
| Immigrants | Lebanon | 97.4 /100 | #102 | Exceptional $101,124 |
| Immigrants | Moldova | 97.4 /100 | #103 | Exceptional $101,091 |
| Immigrants | Poland | 97.4 /100 | #104 | Exceptional $101,065 |
| Immigrants | Vietnam | 96.5 /100 | #105 | Exceptional $100,535 |
| Immigrants | Brazil | 96.5 /100 | #106 | Exceptional $100,534 |
| Northern Europeans | 96.3 /100 | #107 | Exceptional $100,457 |
| Immigrants | South Eastern Asia | 96.0 /100 | #108 | Exceptional $100,283 |
| Immigrants | North Macedonia | 95.6 /100 | #109 | Exceptional $100,101 |
| Immigrants | Afghanistan | 95.3 /100 | #110 | Exceptional $99,977 |
Demographics Similar to Natives/Alaskans by Householder Income Ages 25 - 44 years
In terms of householder income ages 25 - 44 years, the demographic groups most similar to Natives/Alaskans are Bahamian ($75,395, a difference of 0.34%), Yakama ($76,226, a difference of 0.76%), Hopi ($75,002, a difference of 0.86%), Creek ($74,847, a difference of 1.1%), and Kiowa ($74,776, a difference of 1.2%).
| Demographics | Rating | Rank | Householder Income Ages 25 - 44 years |
| Dutch West Indians | 0.0 /100 | #324 | Tragic $77,260 |
| Sioux | 0.0 /100 | #325 | Tragic $77,089 |
| Houma | 0.0 /100 | #326 | Tragic $77,044 |
| Immigrants | Bahamas | 0.0 /100 | #327 | Tragic $76,910 |
| Immigrants | Cuba | 0.0 /100 | #328 | Tragic $76,701 |
| Seminole | 0.0 /100 | #329 | Tragic $76,584 |
| Yakama | 0.0 /100 | #330 | Tragic $76,226 |
| Natives/Alaskans | 0.0 /100 | #331 | Tragic $75,647 |
| Bahamians | 0.0 /100 | #332 | Tragic $75,395 |
| Hopi | 0.0 /100 | #333 | Tragic $75,002 |
| Creek | 0.0 /100 | #334 | Tragic $74,847 |
| Kiowa | 0.0 /100 | #335 | Tragic $74,776 |
| Yup'ik | 0.0 /100 | #336 | Tragic $73,688 |
| Blacks/African Americans | 0.0 /100 | #337 | Tragic $73,370 |
| Immigrants | Yemen | 0.0 /100 | #338 | Tragic $73,043 |