Immigrants from Malaysia vs Welsh In Labor Force | Age 25-29
COMPARE
Immigrants from Malaysia
Welsh
In Labor Force | Age 25-29
In Labor Force | Age 25-29 Comparison
Immigrants from Malaysia
Welsh
85.0%
IN LABOR FORCE | AGE 25-29
90.4/ 100
METRIC RATING
114th/ 347
METRIC RANK
84.5%
IN LABOR FORCE | AGE 25-29
31.1/ 100
METRIC RATING
190th/ 347
METRIC RANK
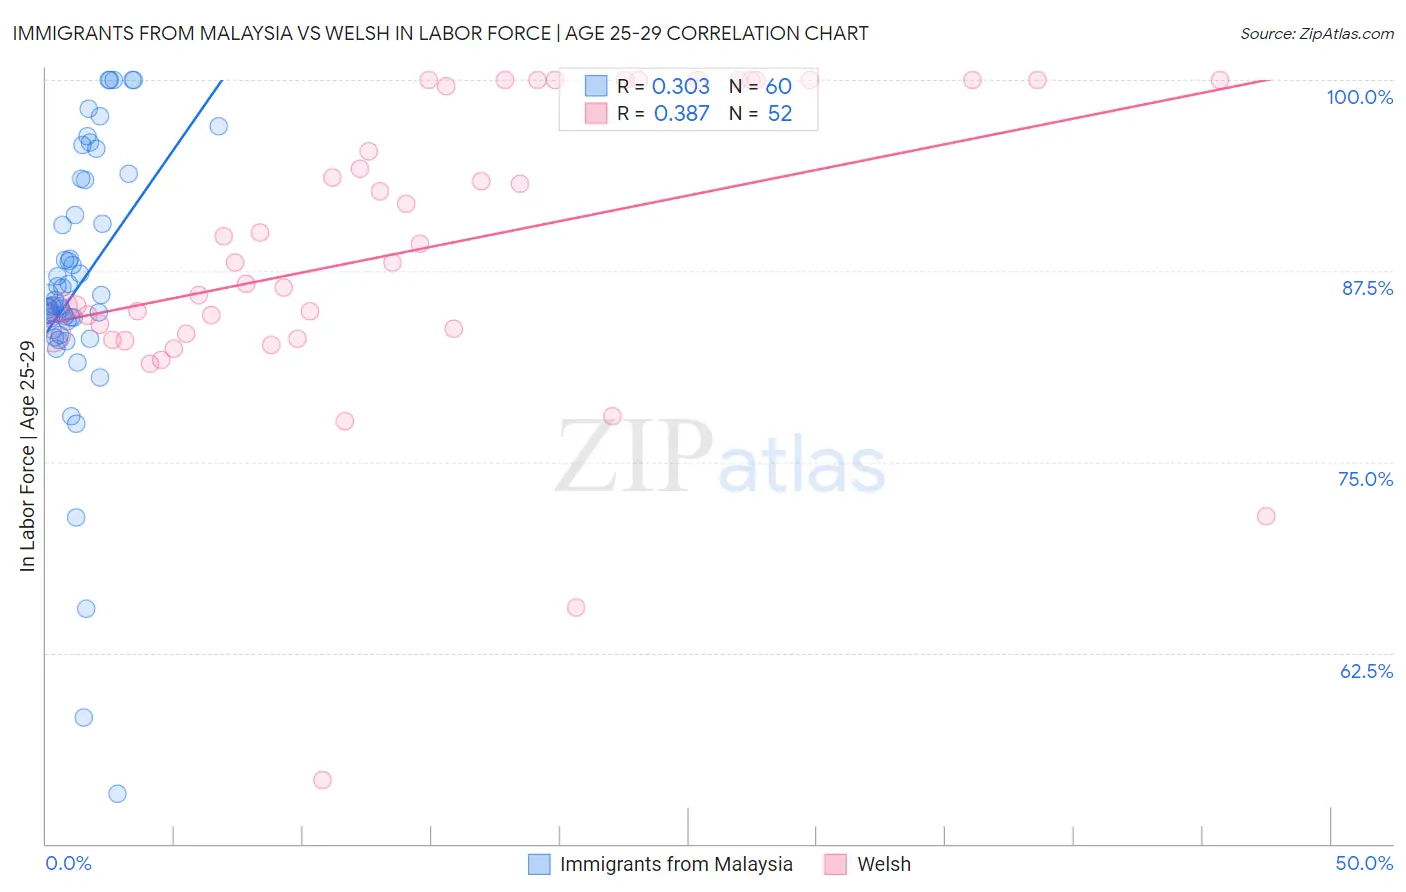
Immigrants from Malaysia vs Welsh In Labor Force | Age 25-29 Correlation Chart
The statistical analysis conducted on geographies consisting of 197,964,000 people shows a mild positive correlation between the proportion of Immigrants from Malaysia and labor force participation rate among population between the ages 25 and 29 in the United States with a correlation coefficient (R) of 0.303 and weighted average of 85.0%. Similarly, the statistical analysis conducted on geographies consisting of 527,913,112 people shows a mild positive correlation between the proportion of Welsh and labor force participation rate among population between the ages 25 and 29 in the United States with a correlation coefficient (R) of 0.387 and weighted average of 84.5%, a difference of 0.56%.
In Labor Force | Age 25-29 Correlation Summary
| Measurement | Immigrants from Malaysia | Welsh |
| Minimum | 53.3% | 54.2% |
| Maximum | 100.0% | 100.0% |
| Range | 46.7% | 45.8% |
| Mean | 86.5% | 89.0% |
| Median | 85.4% | 88.1% |
| Interquartile 25% (IQ1) | 83.9% | 83.4% |
| Interquartile 75% (IQ3) | 92.3% | 100.0% |
| Interquartile Range (IQR) | 8.4% | 16.6% |
| Standard Deviation (Sample) | 9.0% | 9.7% |
| Standard Deviation (Population) | 8.9% | 9.6% |
Similar Demographics by In Labor Force | Age 25-29
Demographics Similar to Immigrants from Malaysia by In Labor Force | Age 25-29
In terms of in labor force | age 25-29, the demographic groups most similar to Immigrants from Malaysia are Senegalese (85.0%, a difference of 0.010%), Irish (85.0%, a difference of 0.010%), Immigrants from Middle Africa (85.0%, a difference of 0.020%), Immigrants from Austria (85.0%, a difference of 0.030%), and Costa Rican (85.0%, a difference of 0.030%).
| Demographics | Rating | Rank | In Labor Force | Age 25-29 |
| Immigrants | Southern Europe | 92.3 /100 | #107 | Exceptional 85.0% |
| Immigrants | Austria | 91.9 /100 | #108 | Exceptional 85.0% |
| Costa Ricans | 91.9 /100 | #109 | Exceptional 85.0% |
| New Zealanders | 91.5 /100 | #110 | Exceptional 85.0% |
| Immigrants | Middle Africa | 91.4 /100 | #111 | Exceptional 85.0% |
| Senegalese | 90.9 /100 | #112 | Exceptional 85.0% |
| Irish | 90.6 /100 | #113 | Exceptional 85.0% |
| Immigrants | Malaysia | 90.4 /100 | #114 | Exceptional 85.0% |
| South Africans | 88.9 /100 | #115 | Excellent 85.0% |
| Chileans | 88.8 /100 | #116 | Excellent 85.0% |
| Immigrants | Belarus | 88.0 /100 | #117 | Excellent 85.0% |
| Finns | 87.8 /100 | #118 | Excellent 85.0% |
| Filipinos | 87.1 /100 | #119 | Excellent 84.9% |
| Immigrants | South Africa | 86.1 /100 | #120 | Excellent 84.9% |
| Immigrants | Chile | 85.6 /100 | #121 | Excellent 84.9% |
Demographics Similar to Welsh by In Labor Force | Age 25-29
In terms of in labor force | age 25-29, the demographic groups most similar to Welsh are Moroccan (84.5%, a difference of 0.010%), Immigrants from Ukraine (84.5%, a difference of 0.020%), Zimbabwean (84.5%, a difference of 0.020%), Immigrants from Belgium (84.6%, a difference of 0.030%), and Immigrants from Portugal (84.6%, a difference of 0.030%).
| Demographics | Rating | Rank | In Labor Force | Age 25-29 |
| Scottish | 40.1 /100 | #183 | Average 84.6% |
| Immigrants | Kuwait | 38.2 /100 | #184 | Fair 84.6% |
| Immigrants | Denmark | 37.0 /100 | #185 | Fair 84.6% |
| Immigrants | Belgium | 35.0 /100 | #186 | Fair 84.6% |
| Immigrants | Portugal | 34.7 /100 | #187 | Fair 84.6% |
| Immigrants | Ukraine | 33.7 /100 | #188 | Fair 84.5% |
| Moroccans | 32.6 /100 | #189 | Fair 84.5% |
| Welsh | 31.1 /100 | #190 | Fair 84.5% |
| Zimbabweans | 28.7 /100 | #191 | Fair 84.5% |
| English | 25.8 /100 | #192 | Fair 84.5% |
| South American Indians | 25.0 /100 | #193 | Fair 84.5% |
| Portuguese | 21.2 /100 | #194 | Fair 84.4% |
| Immigrants | Israel | 20.8 /100 | #195 | Fair 84.4% |
| Immigrants | South Eastern Asia | 19.5 /100 | #196 | Poor 84.4% |
| Tlingit-Haida | 19.3 /100 | #197 | Poor 84.4% |