Native Hawaiian vs Welsh 3 or more Vehicles in Household
COMPARE
Native Hawaiian
Welsh
3 or more Vehicles in Household
3 or more Vehicles in Household Comparison
Native Hawaiians
Welsh
24.9%
3 OR MORE VEHICLES IN HOUSEHOLD
100.0/ 100
METRIC RATING
9th/ 347
METRIC RANK
22.6%
3 OR MORE VEHICLES IN HOUSEHOLD
100.0/ 100
METRIC RATING
52nd/ 347
METRIC RANK
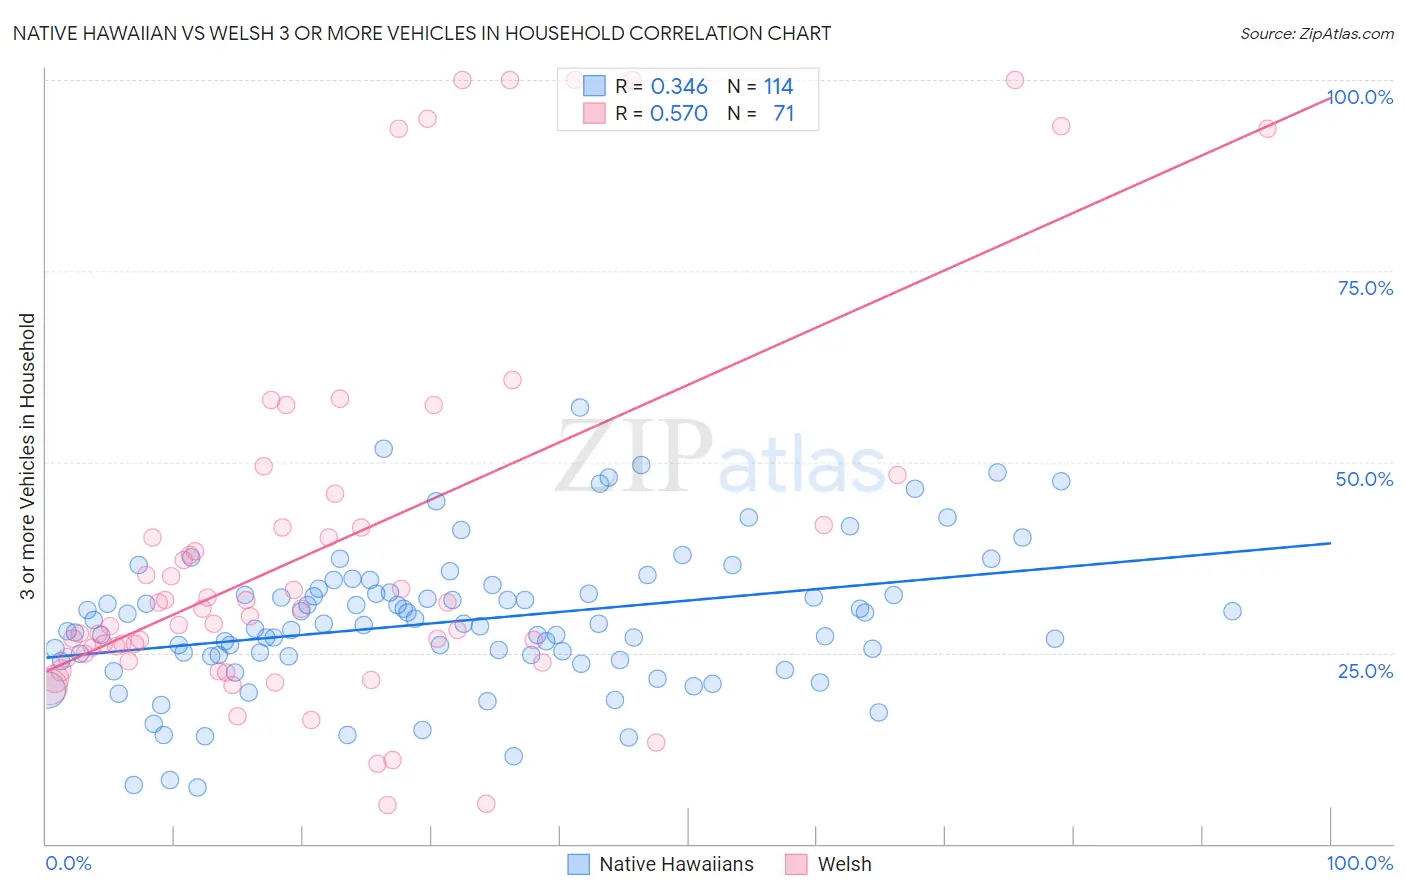
Native Hawaiian vs Welsh 3 or more Vehicles in Household Correlation Chart
The statistical analysis conducted on geographies consisting of 331,830,986 people shows a mild positive correlation between the proportion of Native Hawaiians and percentage of households with 3 or more vehicles available in the United States with a correlation coefficient (R) of 0.346 and weighted average of 24.9%. Similarly, the statistical analysis conducted on geographies consisting of 528,014,729 people shows a substantial positive correlation between the proportion of Welsh and percentage of households with 3 or more vehicles available in the United States with a correlation coefficient (R) of 0.570 and weighted average of 22.6%, a difference of 10.5%.
3 or more Vehicles in Household Correlation Summary
| Measurement | Native Hawaiian | Welsh |
| Minimum | 7.3% | 5.1% |
| Maximum | 57.1% | 100.0% |
| Range | 49.8% | 94.9% |
| Mean | 29.1% | 39.0% |
| Median | 28.7% | 30.7% |
| Interquartile 25% (IQ1) | 24.6% | 24.3% |
| Interquartile 75% (IQ3) | 32.8% | 41.7% |
| Interquartile Range (IQR) | 8.2% | 17.3% |
| Standard Deviation (Sample) | 9.2% | 25.2% |
| Standard Deviation (Population) | 9.2% | 25.0% |
Similar Demographics by 3 or more Vehicles in Household
Demographics Similar to Native Hawaiians by 3 or more Vehicles in Household
In terms of 3 or more vehicles in household, the demographic groups most similar to Native Hawaiians are Nepalese (24.9%, a difference of 0.090%), Samoan (25.0%, a difference of 0.10%), Shoshone (24.9%, a difference of 0.19%), Danish (24.7%, a difference of 0.88%), and Mexican (24.7%, a difference of 0.96%).
| Demographics | Rating | Rank | 3 or more Vehicles in Household |
| Spanish American Indians | 100.0 /100 | #2 | Exceptional 26.9% |
| Tongans | 100.0 /100 | #3 | Exceptional 26.5% |
| Arapaho | 100.0 /100 | #4 | Exceptional 26.4% |
| Puget Sound Salish | 100.0 /100 | #5 | Exceptional 26.4% |
| Immigrants | Fiji | 100.0 /100 | #6 | Exceptional 26.1% |
| Colville | 100.0 /100 | #7 | Exceptional 25.8% |
| Samoans | 100.0 /100 | #8 | Exceptional 25.0% |
| Native Hawaiians | 100.0 /100 | #9 | Exceptional 24.9% |
| Nepalese | 100.0 /100 | #10 | Exceptional 24.9% |
| Shoshone | 100.0 /100 | #11 | Exceptional 24.9% |
| Danes | 100.0 /100 | #12 | Exceptional 24.7% |
| Mexicans | 100.0 /100 | #13 | Exceptional 24.7% |
| Immigrants | Mexico | 100.0 /100 | #14 | Exceptional 24.6% |
| Hawaiians | 100.0 /100 | #15 | Exceptional 24.3% |
| Basques | 100.0 /100 | #16 | Exceptional 24.3% |
Demographics Similar to Welsh by 3 or more Vehicles in Household
In terms of 3 or more vehicles in household, the demographic groups most similar to Welsh are White/Caucasian (22.6%, a difference of 0.040%), Sioux (22.6%, a difference of 0.050%), Scotch-Irish (22.6%, a difference of 0.11%), Scottish (22.6%, a difference of 0.21%), and Malaysian (22.6%, a difference of 0.22%).
| Demographics | Rating | Rank | 3 or more Vehicles in Household |
| Ute | 100.0 /100 | #45 | Exceptional 22.7% |
| Americans | 100.0 /100 | #46 | Exceptional 22.6% |
| Malaysians | 100.0 /100 | #47 | Exceptional 22.6% |
| Scottish | 100.0 /100 | #48 | Exceptional 22.6% |
| Scotch-Irish | 100.0 /100 | #49 | Exceptional 22.6% |
| Sioux | 100.0 /100 | #50 | Exceptional 22.6% |
| Whites/Caucasians | 100.0 /100 | #51 | Exceptional 22.6% |
| Welsh | 100.0 /100 | #52 | Exceptional 22.6% |
| Czechs | 100.0 /100 | #53 | Exceptional 22.5% |
| Crow | 100.0 /100 | #54 | Exceptional 22.5% |
| Immigrants | Laos | 100.0 /100 | #55 | Exceptional 22.4% |
| Hispanics or Latinos | 100.0 /100 | #56 | Exceptional 22.4% |
| Pennsylvania Germans | 100.0 /100 | #57 | Exceptional 22.3% |
| Spaniards | 100.0 /100 | #58 | Exceptional 22.3% |
| Navajo | 100.0 /100 | #59 | Exceptional 22.3% |