Palestinian vs Welsh 3 or more Vehicles in Household
COMPARE
Palestinian
Welsh
3 or more Vehicles in Household
3 or more Vehicles in Household Comparison
Palestinians
Welsh
20.1%
3 OR MORE VEHICLES IN HOUSEHOLD
83.9/ 100
METRIC RATING
145th/ 347
METRIC RANK
22.6%
3 OR MORE VEHICLES IN HOUSEHOLD
100.0/ 100
METRIC RATING
52nd/ 347
METRIC RANK
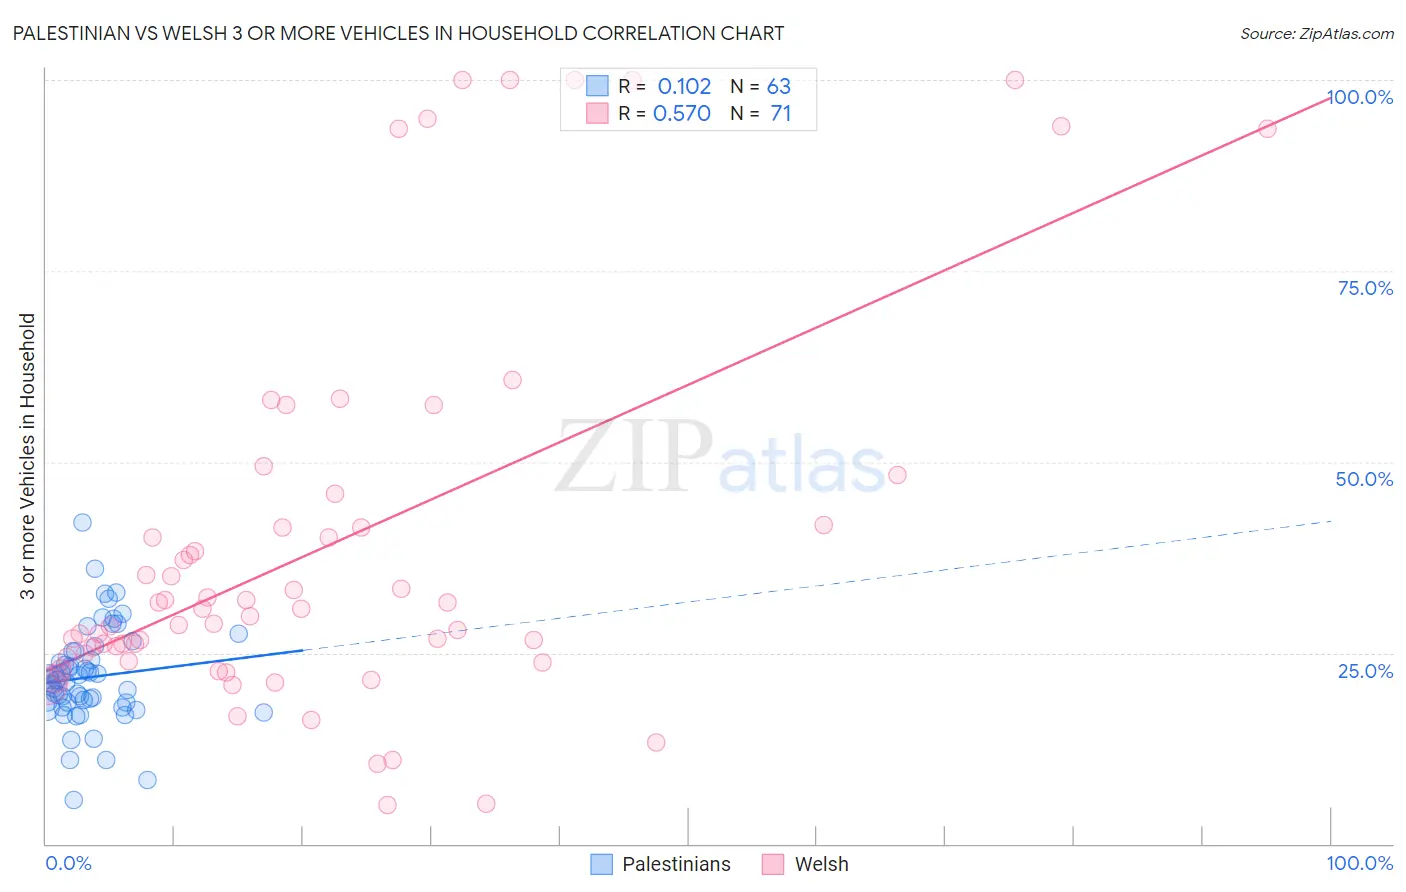
Palestinian vs Welsh 3 or more Vehicles in Household Correlation Chart
The statistical analysis conducted on geographies consisting of 216,328,479 people shows a poor positive correlation between the proportion of Palestinians and percentage of households with 3 or more vehicles available in the United States with a correlation coefficient (R) of 0.102 and weighted average of 20.1%. Similarly, the statistical analysis conducted on geographies consisting of 528,014,729 people shows a substantial positive correlation between the proportion of Welsh and percentage of households with 3 or more vehicles available in the United States with a correlation coefficient (R) of 0.570 and weighted average of 22.6%, a difference of 12.2%.
3 or more Vehicles in Household Correlation Summary
| Measurement | Palestinian | Welsh |
| Minimum | 5.8% | 5.1% |
| Maximum | 42.0% | 100.0% |
| Range | 36.2% | 94.9% |
| Mean | 21.8% | 39.0% |
| Median | 21.5% | 30.7% |
| Interquartile 25% (IQ1) | 18.5% | 24.3% |
| Interquartile 75% (IQ3) | 25.2% | 41.7% |
| Interquartile Range (IQR) | 6.7% | 17.3% |
| Standard Deviation (Sample) | 6.3% | 25.2% |
| Standard Deviation (Population) | 6.3% | 25.0% |
Similar Demographics by 3 or more Vehicles in Household
Demographics Similar to Palestinians by 3 or more Vehicles in Household
In terms of 3 or more vehicles in household, the demographic groups most similar to Palestinians are Iranian (20.1%, a difference of 0.010%), Australian (20.1%, a difference of 0.040%), Lithuanian (20.1%, a difference of 0.060%), Jordanian (20.1%, a difference of 0.070%), and Slovak (20.1%, a difference of 0.12%).
| Demographics | Rating | Rank | 3 or more Vehicles in Household |
| Aleuts | 86.3 /100 | #138 | Excellent 20.2% |
| Slovenes | 85.5 /100 | #139 | Excellent 20.2% |
| French American Indians | 85.3 /100 | #140 | Excellent 20.1% |
| Ottawa | 84.9 /100 | #141 | Excellent 20.1% |
| Jordanians | 84.4 /100 | #142 | Excellent 20.1% |
| Lithuanians | 84.4 /100 | #143 | Excellent 20.1% |
| Iranians | 84.0 /100 | #144 | Excellent 20.1% |
| Palestinians | 83.9 /100 | #145 | Excellent 20.1% |
| Australians | 83.6 /100 | #146 | Excellent 20.1% |
| Slovaks | 83.0 /100 | #147 | Excellent 20.1% |
| Guatemalans | 82.6 /100 | #148 | Excellent 20.1% |
| Immigrants | Iran | 80.9 /100 | #149 | Excellent 20.0% |
| Immigrants | Immigrants | 80.8 /100 | #150 | Excellent 20.0% |
| Taiwanese | 80.6 /100 | #151 | Excellent 20.0% |
| Lebanese | 79.8 /100 | #152 | Good 20.0% |
Demographics Similar to Welsh by 3 or more Vehicles in Household
In terms of 3 or more vehicles in household, the demographic groups most similar to Welsh are White/Caucasian (22.6%, a difference of 0.040%), Sioux (22.6%, a difference of 0.050%), Scotch-Irish (22.6%, a difference of 0.11%), Scottish (22.6%, a difference of 0.21%), and Malaysian (22.6%, a difference of 0.22%).
| Demographics | Rating | Rank | 3 or more Vehicles in Household |
| Ute | 100.0 /100 | #45 | Exceptional 22.7% |
| Americans | 100.0 /100 | #46 | Exceptional 22.6% |
| Malaysians | 100.0 /100 | #47 | Exceptional 22.6% |
| Scottish | 100.0 /100 | #48 | Exceptional 22.6% |
| Scotch-Irish | 100.0 /100 | #49 | Exceptional 22.6% |
| Sioux | 100.0 /100 | #50 | Exceptional 22.6% |
| Whites/Caucasians | 100.0 /100 | #51 | Exceptional 22.6% |
| Welsh | 100.0 /100 | #52 | Exceptional 22.6% |
| Czechs | 100.0 /100 | #53 | Exceptional 22.5% |
| Crow | 100.0 /100 | #54 | Exceptional 22.5% |
| Immigrants | Laos | 100.0 /100 | #55 | Exceptional 22.4% |
| Hispanics or Latinos | 100.0 /100 | #56 | Exceptional 22.4% |
| Pennsylvania Germans | 100.0 /100 | #57 | Exceptional 22.3% |
| Spaniards | 100.0 /100 | #58 | Exceptional 22.3% |
| Navajo | 100.0 /100 | #59 | Exceptional 22.3% |