Maltese vs Danish 3 or more Vehicles in Household
COMPARE
Maltese
Danish
3 or more Vehicles in Household
3 or more Vehicles in Household Comparison
Maltese
Danes
20.5%
3 OR MORE VEHICLES IN HOUSEHOLD
93.9/ 100
METRIC RATING
120th/ 347
METRIC RANK
24.7%
3 OR MORE VEHICLES IN HOUSEHOLD
100.0/ 100
METRIC RATING
12th/ 347
METRIC RANK
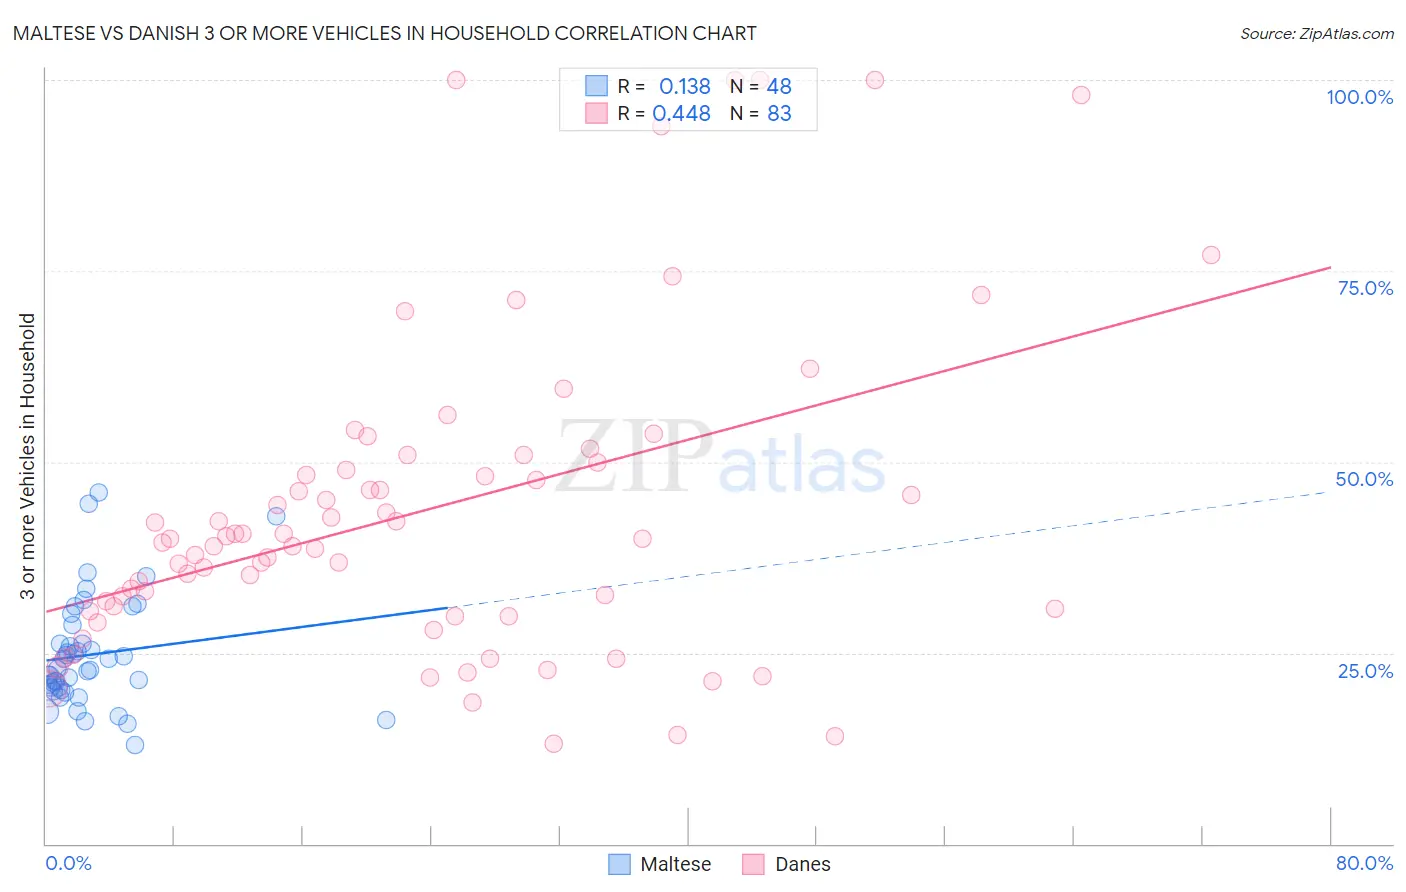
Maltese vs Danish 3 or more Vehicles in Household Correlation Chart
The statistical analysis conducted on geographies consisting of 126,427,013 people shows a poor positive correlation between the proportion of Maltese and percentage of households with 3 or more vehicles available in the United States with a correlation coefficient (R) of 0.138 and weighted average of 20.5%. Similarly, the statistical analysis conducted on geographies consisting of 473,746,883 people shows a moderate positive correlation between the proportion of Danes and percentage of households with 3 or more vehicles available in the United States with a correlation coefficient (R) of 0.448 and weighted average of 24.7%, a difference of 20.6%.
3 or more Vehicles in Household Correlation Summary
| Measurement | Maltese | Danish |
| Minimum | 12.9% | 13.0% |
| Maximum | 45.9% | 100.0% |
| Range | 33.0% | 87.0% |
| Mean | 24.8% | 43.5% |
| Median | 22.8% | 40.0% |
| Interquartile 25% (IQ1) | 20.2% | 30.5% |
| Interquartile 75% (IQ3) | 27.4% | 50.0% |
| Interquartile Range (IQR) | 7.1% | 19.5% |
| Standard Deviation (Sample) | 7.3% | 20.6% |
| Standard Deviation (Population) | 7.2% | 20.5% |
Similar Demographics by 3 or more Vehicles in Household
Demographics Similar to Maltese by 3 or more Vehicles in Household
In terms of 3 or more vehicles in household, the demographic groups most similar to Maltese are Immigrants from Thailand (20.5%, a difference of 0.010%), German Russian (20.5%, a difference of 0.060%), Immigrants from Korea (20.5%, a difference of 0.060%), Immigrants from Latin America (20.5%, a difference of 0.19%), and Costa Rican (20.6%, a difference of 0.23%).
| Demographics | Rating | Rank | 3 or more Vehicles in Household |
| Immigrants | England | 96.2 /100 | #113 | Exceptional 20.7% |
| Burmese | 95.8 /100 | #114 | Exceptional 20.6% |
| French Canadians | 95.0 /100 | #115 | Exceptional 20.6% |
| Italians | 94.9 /100 | #116 | Exceptional 20.6% |
| Croatians | 94.9 /100 | #117 | Exceptional 20.6% |
| Costa Ricans | 94.6 /100 | #118 | Exceptional 20.6% |
| Immigrants | Latin America | 94.5 /100 | #119 | Exceptional 20.5% |
| Maltese | 93.9 /100 | #120 | Exceptional 20.5% |
| Immigrants | Thailand | 93.8 /100 | #121 | Exceptional 20.5% |
| German Russians | 93.7 /100 | #122 | Exceptional 20.5% |
| Immigrants | Korea | 93.7 /100 | #123 | Exceptional 20.5% |
| Central Americans | 93.1 /100 | #124 | Exceptional 20.5% |
| Immigrants | Netherlands | 92.9 /100 | #125 | Exceptional 20.4% |
| Slavs | 92.1 /100 | #126 | Exceptional 20.4% |
| Immigrants | Bolivia | 92.0 /100 | #127 | Exceptional 20.4% |
Demographics Similar to Danes by 3 or more Vehicles in Household
In terms of 3 or more vehicles in household, the demographic groups most similar to Danes are Mexican (24.7%, a difference of 0.080%), Immigrants from Mexico (24.6%, a difference of 0.52%), Shoshone (24.9%, a difference of 0.69%), Nepalese (24.9%, a difference of 0.79%), and Native Hawaiian (24.9%, a difference of 0.88%).
| Demographics | Rating | Rank | 3 or more Vehicles in Household |
| Puget Sound Salish | 100.0 /100 | #5 | Exceptional 26.4% |
| Immigrants | Fiji | 100.0 /100 | #6 | Exceptional 26.1% |
| Colville | 100.0 /100 | #7 | Exceptional 25.8% |
| Samoans | 100.0 /100 | #8 | Exceptional 25.0% |
| Native Hawaiians | 100.0 /100 | #9 | Exceptional 24.9% |
| Nepalese | 100.0 /100 | #10 | Exceptional 24.9% |
| Shoshone | 100.0 /100 | #11 | Exceptional 24.9% |
| Danes | 100.0 /100 | #12 | Exceptional 24.7% |
| Mexicans | 100.0 /100 | #13 | Exceptional 24.7% |
| Immigrants | Mexico | 100.0 /100 | #14 | Exceptional 24.6% |
| Hawaiians | 100.0 /100 | #15 | Exceptional 24.3% |
| Basques | 100.0 /100 | #16 | Exceptional 24.3% |
| Koreans | 100.0 /100 | #17 | Exceptional 24.1% |
| Norwegians | 100.0 /100 | #18 | Exceptional 23.9% |
| Chinese | 100.0 /100 | #19 | Exceptional 23.9% |