Immigrants from Lebanon vs Immigrants from Guyana 2 or more Vehicles in Household
COMPARE
Immigrants from Lebanon
Immigrants from Guyana
2 or more Vehicles in Household
2 or more Vehicles in Household Comparison
Immigrants from Lebanon
Immigrants from Guyana
57.2%
2 OR MORE VEHICLES IN HOUSEHOLD
96.8/ 100
METRIC RATING
114th/ 347
METRIC RANK
35.0%
2 OR MORE VEHICLES IN HOUSEHOLD
0.0/ 100
METRIC RATING
343rd/ 347
METRIC RANK
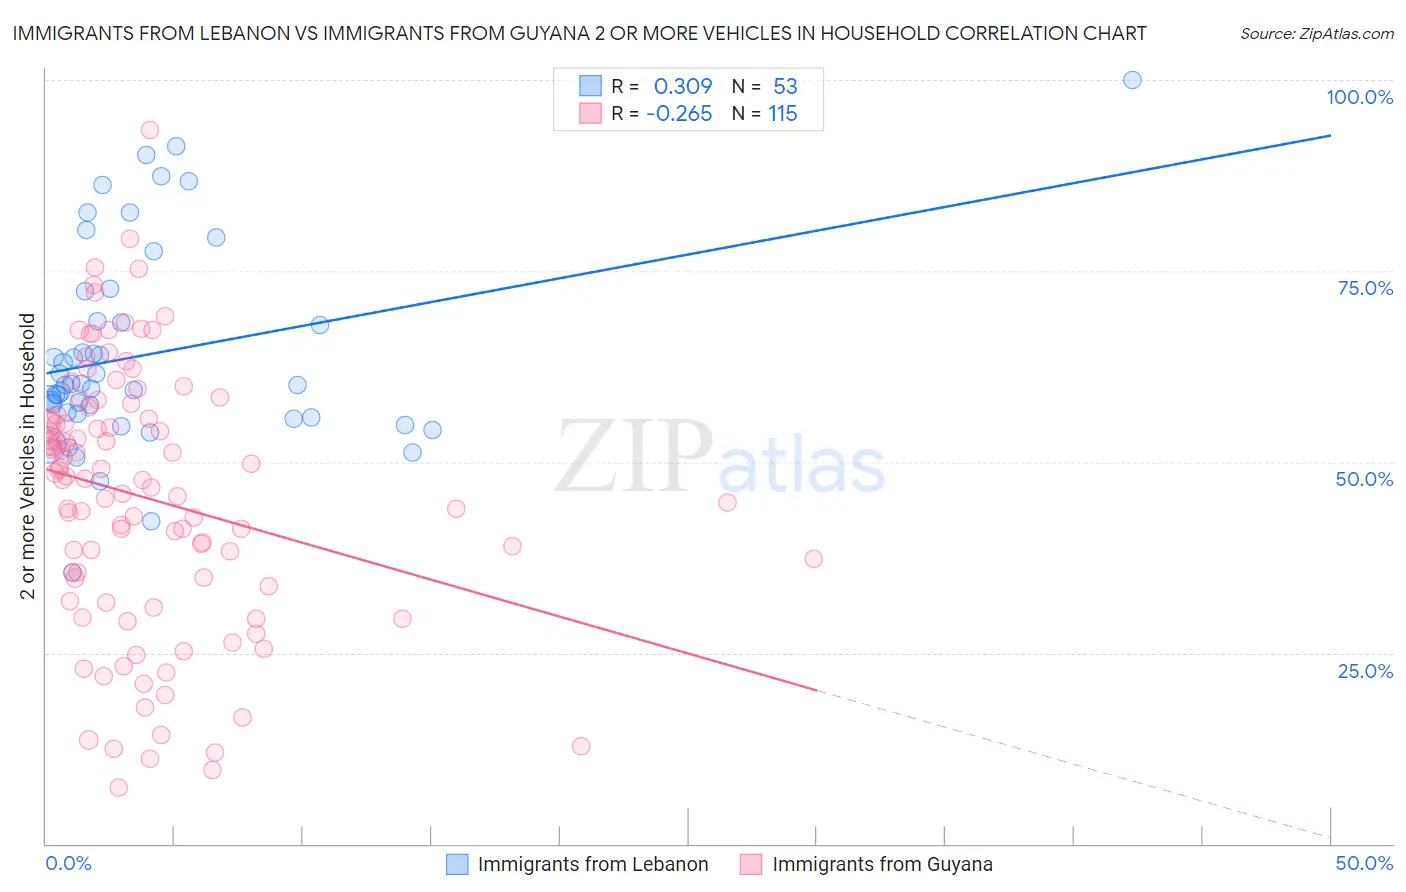
Immigrants from Lebanon vs Immigrants from Guyana 2 or more Vehicles in Household Correlation Chart
The statistical analysis conducted on geographies consisting of 217,126,913 people shows a mild positive correlation between the proportion of Immigrants from Lebanon and percentage of households with 2 or more vehicles available in the United States with a correlation coefficient (R) of 0.309 and weighted average of 57.2%. Similarly, the statistical analysis conducted on geographies consisting of 183,691,149 people shows a weak negative correlation between the proportion of Immigrants from Guyana and percentage of households with 2 or more vehicles available in the United States with a correlation coefficient (R) of -0.265 and weighted average of 35.0%, a difference of 63.5%.
2 or more Vehicles in Household Correlation Summary
| Measurement | Immigrants from Lebanon | Immigrants from Guyana |
| Minimum | 35.5% | 7.4% |
| Maximum | 100.0% | 93.5% |
| Range | 64.5% | 86.1% |
| Mean | 64.1% | 45.2% |
| Median | 60.1% | 47.6% |
| Interquartile 25% (IQ1) | 56.0% | 33.7% |
| Interquartile 75% (IQ3) | 70.4% | 56.2% |
| Interquartile Range (IQR) | 14.3% | 22.5% |
| Standard Deviation (Sample) | 13.2% | 17.3% |
| Standard Deviation (Population) | 13.1% | 17.2% |
Similar Demographics by 2 or more Vehicles in Household
Demographics Similar to Immigrants from Lebanon by 2 or more Vehicles in Household
In terms of 2 or more vehicles in household, the demographic groups most similar to Immigrants from Lebanon are Zimbabwean (57.2%, a difference of 0.030%), Chippewa (57.2%, a difference of 0.050%), Immigrants from Jordan (57.2%, a difference of 0.070%), Iraqi (57.1%, a difference of 0.26%), and Asian (57.0%, a difference of 0.42%).
| Demographics | Rating | Rank | 2 or more Vehicles in Household |
| Immigrants | Netherlands | 98.2 /100 | #107 | Exceptional 57.5% |
| Immigrants | Canada | 98.1 /100 | #108 | Exceptional 57.5% |
| Immigrants | North America | 98.1 /100 | #109 | Exceptional 57.5% |
| Japanese | 98.0 /100 | #110 | Exceptional 57.5% |
| Greeks | 98.0 /100 | #111 | Exceptional 57.5% |
| Pueblo | 98.0 /100 | #112 | Exceptional 57.5% |
| Zimbabweans | 96.9 /100 | #113 | Exceptional 57.2% |
| Immigrants | Lebanon | 96.8 /100 | #114 | Exceptional 57.2% |
| Chippewa | 96.6 /100 | #115 | Exceptional 57.2% |
| Immigrants | Jordan | 96.6 /100 | #116 | Exceptional 57.2% |
| Iraqis | 95.8 /100 | #117 | Exceptional 57.1% |
| Asians | 95.1 /100 | #118 | Exceptional 57.0% |
| Natives/Alaskans | 95.0 /100 | #119 | Exceptional 57.0% |
| Costa Ricans | 94.7 /100 | #120 | Exceptional 56.9% |
| Sioux | 93.8 /100 | #121 | Exceptional 56.8% |
Demographics Similar to Immigrants from Guyana by 2 or more Vehicles in Household
In terms of 2 or more vehicles in household, the demographic groups most similar to Immigrants from Guyana are Yup'ik (34.9%, a difference of 0.17%), Dominican (35.3%, a difference of 0.89%), Guyanese (35.4%, a difference of 1.1%), British West Indian (35.4%, a difference of 1.1%), and Immigrants from Barbados (35.8%, a difference of 2.2%).
| Demographics | Rating | Rank | 2 or more Vehicles in Household |
| Immigrants | Ecuador | 0.0 /100 | #333 | Tragic 40.5% |
| Immigrants | Trinidad and Tobago | 0.0 /100 | #334 | Tragic 40.3% |
| Immigrants | Bangladesh | 0.0 /100 | #335 | Tragic 38.8% |
| Vietnamese | 0.0 /100 | #336 | Tragic 38.5% |
| Barbadians | 0.0 /100 | #337 | Tragic 38.3% |
| Immigrants | Uzbekistan | 0.0 /100 | #338 | Tragic 37.9% |
| Immigrants | Barbados | 0.0 /100 | #339 | Tragic 35.8% |
| British West Indians | 0.0 /100 | #340 | Tragic 35.4% |
| Guyanese | 0.0 /100 | #341 | Tragic 35.4% |
| Dominicans | 0.0 /100 | #342 | Tragic 35.3% |
| Immigrants | Guyana | 0.0 /100 | #343 | Tragic 35.0% |
| Yup'ik | 0.0 /100 | #344 | Tragic 34.9% |
| Immigrants | Dominican Republic | 0.0 /100 | #345 | Tragic 33.2% |
| Immigrants | St. Vincent and the Grenadines | 0.0 /100 | #346 | Tragic 31.0% |
| Immigrants | Grenada | 0.0 /100 | #347 | Tragic 28.7% |