Kenyan vs Moroccan 4 or more Vehicles in Household
COMPARE
Kenyan
Moroccan
4 or more Vehicles in Household
4 or more Vehicles in Household Comparison
Kenyans
Moroccans
6.1%
4 OR MORE VEHICLES IN HOUSEHOLD
18.5/ 100
METRIC RATING
206th/ 347
METRIC RANK
4.9%
4 OR MORE VEHICLES IN HOUSEHOLD
0.0/ 100
METRIC RATING
310th/ 347
METRIC RANK
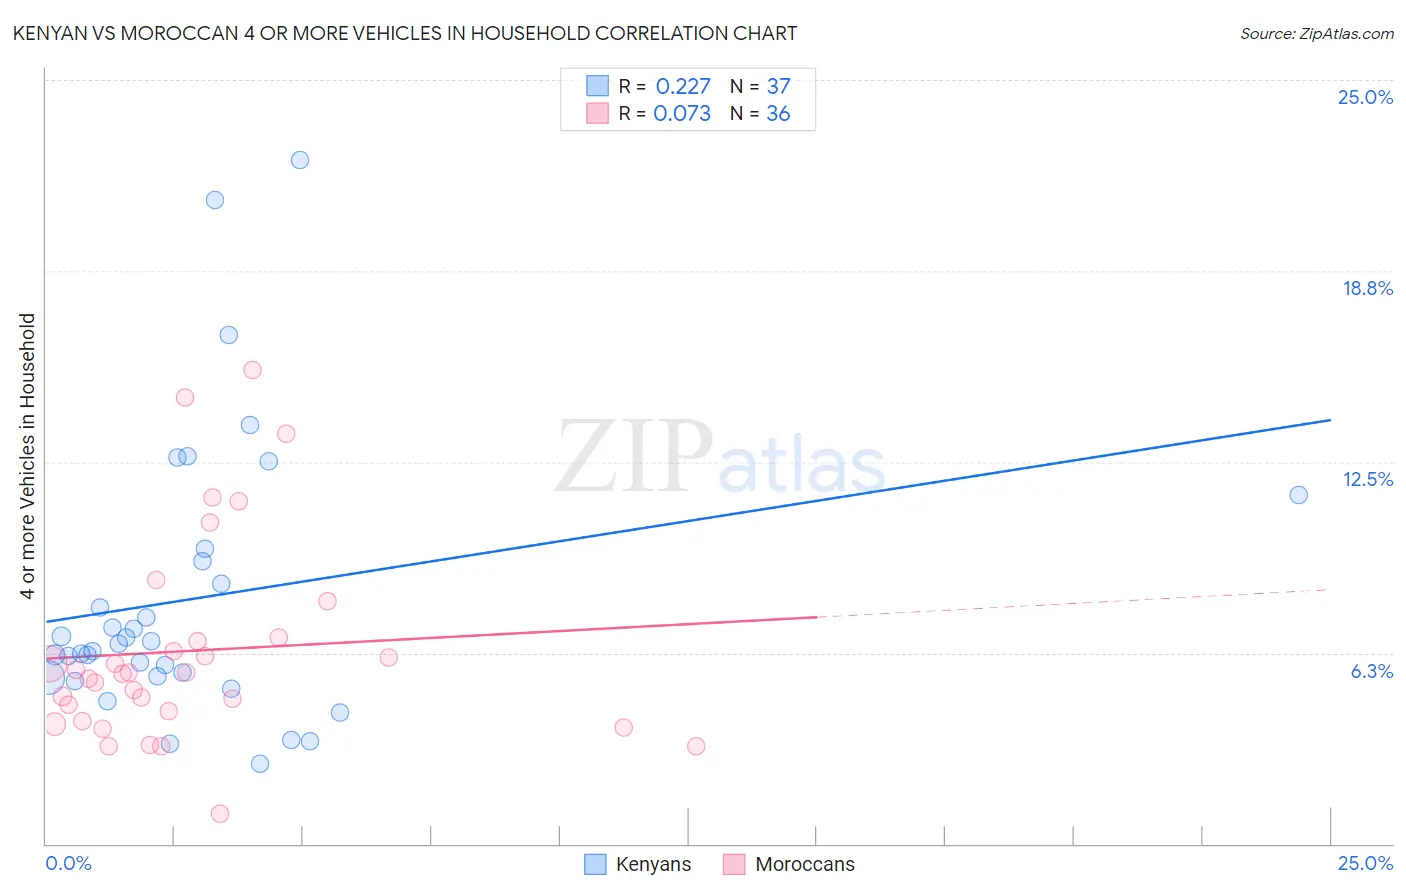
Kenyan vs Moroccan 4 or more Vehicles in Household Correlation Chart
The statistical analysis conducted on geographies consisting of 167,746,674 people shows a weak positive correlation between the proportion of Kenyans and percentage of households with 4 or more vehicles available in the United States with a correlation coefficient (R) of 0.227 and weighted average of 6.1%. Similarly, the statistical analysis conducted on geographies consisting of 200,763,454 people shows a slight positive correlation between the proportion of Moroccans and percentage of households with 4 or more vehicles available in the United States with a correlation coefficient (R) of 0.073 and weighted average of 4.9%, a difference of 23.9%.
4 or more Vehicles in Household Correlation Summary
| Measurement | Kenyan | Moroccan |
| Minimum | 2.6% | 0.99% |
| Maximum | 22.4% | 15.5% |
| Range | 19.8% | 14.5% |
| Mean | 8.1% | 6.3% |
| Median | 6.5% | 5.6% |
| Interquartile 25% (IQ1) | 5.5% | 4.2% |
| Interquartile 75% (IQ3) | 9.5% | 6.7% |
| Interquartile Range (IQR) | 4.0% | 2.5% |
| Standard Deviation (Sample) | 4.6% | 3.3% |
| Standard Deviation (Population) | 4.5% | 3.3% |
Similar Demographics by 4 or more Vehicles in Household
Demographics Similar to Kenyans by 4 or more Vehicles in Household
In terms of 4 or more vehicles in household, the demographic groups most similar to Kenyans are Honduran (6.1%, a difference of 0.14%), Immigrants from Belize (6.1%, a difference of 0.23%), Immigrants from Chile (6.1%, a difference of 0.28%), Immigrants from Sierra Leone (6.1%, a difference of 0.33%), and Immigrants from South Central Asia (6.1%, a difference of 0.47%).
| Demographics | Rating | Rank | 4 or more Vehicles in Household |
| Immigrants | Norway | 21.8 /100 | #199 | Fair 6.1% |
| Latvians | 21.7 /100 | #200 | Fair 6.1% |
| Egyptians | 21.4 /100 | #201 | Fair 6.1% |
| Immigrants | South Central Asia | 21.3 /100 | #202 | Fair 6.1% |
| Immigrants | Sierra Leone | 20.5 /100 | #203 | Fair 6.1% |
| Immigrants | Belize | 19.8 /100 | #204 | Poor 6.1% |
| Hondurans | 19.3 /100 | #205 | Poor 6.1% |
| Kenyans | 18.5 /100 | #206 | Poor 6.1% |
| Immigrants | Chile | 16.9 /100 | #207 | Poor 6.1% |
| Immigrants | Nigeria | 15.6 /100 | #208 | Poor 6.1% |
| Immigrants | Honduras | 15.4 /100 | #209 | Poor 6.1% |
| Immigrants | Zimbabwe | 15.1 /100 | #210 | Poor 6.0% |
| Panamanians | 14.8 /100 | #211 | Poor 6.0% |
| Immigrants | Egypt | 14.7 /100 | #212 | Poor 6.0% |
| Arabs | 14.4 /100 | #213 | Poor 6.0% |
Demographics Similar to Moroccans by 4 or more Vehicles in Household
In terms of 4 or more vehicles in household, the demographic groups most similar to Moroccans are Houma (4.9%, a difference of 0.010%), Immigrants from Somalia (4.9%, a difference of 0.38%), Paraguayan (4.9%, a difference of 0.54%), Menominee (5.0%, a difference of 1.3%), and Immigrants from Serbia (5.0%, a difference of 2.2%).
| Demographics | Rating | Rank | 4 or more Vehicles in Household |
| Immigrants | Greece | 0.0 /100 | #303 | Tragic 5.1% |
| Cypriots | 0.0 /100 | #304 | Tragic 5.0% |
| Somalis | 0.0 /100 | #305 | Tragic 5.0% |
| Immigrants | Serbia | 0.0 /100 | #306 | Tragic 5.0% |
| Menominee | 0.0 /100 | #307 | Tragic 5.0% |
| Paraguayans | 0.0 /100 | #308 | Tragic 4.9% |
| Immigrants | Somalia | 0.0 /100 | #309 | Tragic 4.9% |
| Moroccans | 0.0 /100 | #310 | Tragic 4.9% |
| Houma | 0.0 /100 | #311 | Tragic 4.9% |
| Albanians | 0.0 /100 | #312 | Tragic 4.8% |
| Immigrants | Israel | 0.0 /100 | #313 | Tragic 4.8% |
| Immigrants | West Indies | 0.0 /100 | #314 | Tragic 4.7% |
| Immigrants | Belarus | 0.0 /100 | #315 | Tragic 4.7% |
| Puerto Ricans | 0.0 /100 | #316 | Tragic 4.7% |
| U.S. Virgin Islanders | 0.0 /100 | #317 | Tragic 4.6% |