Paraguayan vs Moroccan 4 or more Vehicles in Household
COMPARE
Paraguayan
Moroccan
4 or more Vehicles in Household
4 or more Vehicles in Household Comparison
Paraguayans
Moroccans
4.9%
4 OR MORE VEHICLES IN HOUSEHOLD
0.0/ 100
METRIC RATING
308th/ 347
METRIC RANK
4.9%
4 OR MORE VEHICLES IN HOUSEHOLD
0.0/ 100
METRIC RATING
310th/ 347
METRIC RANK
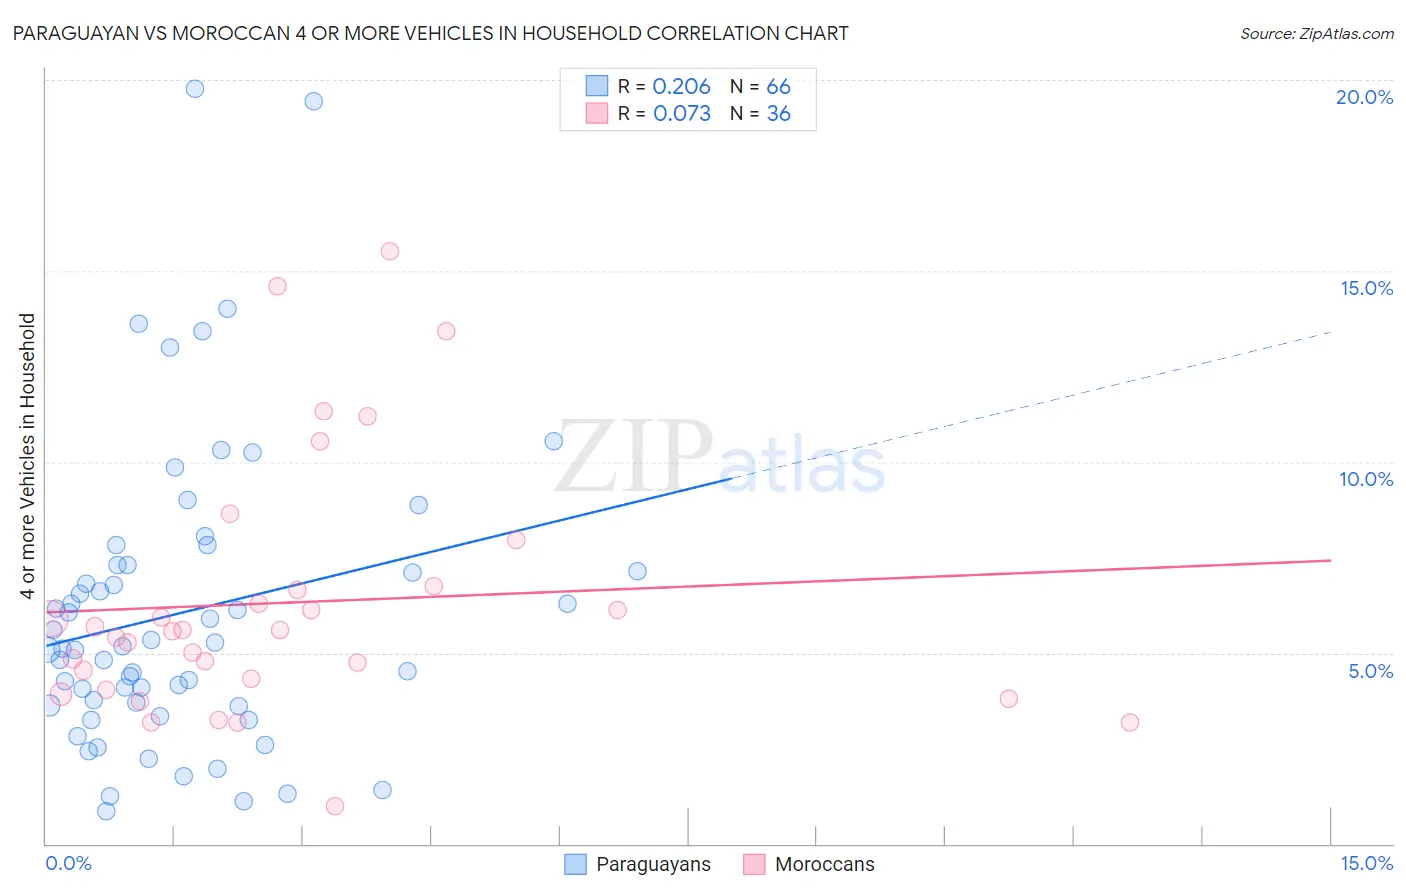
Paraguayan vs Moroccan 4 or more Vehicles in Household Correlation Chart
The statistical analysis conducted on geographies consisting of 94,888,057 people shows a weak positive correlation between the proportion of Paraguayans and percentage of households with 4 or more vehicles available in the United States with a correlation coefficient (R) of 0.206 and weighted average of 4.9%. Similarly, the statistical analysis conducted on geographies consisting of 200,763,454 people shows a slight positive correlation between the proportion of Moroccans and percentage of households with 4 or more vehicles available in the United States with a correlation coefficient (R) of 0.073 and weighted average of 4.9%, a difference of 0.54%.
4 or more Vehicles in Household Correlation Summary
| Measurement | Paraguayan | Moroccan |
| Minimum | 0.86% | 0.99% |
| Maximum | 19.8% | 15.5% |
| Range | 18.9% | 14.5% |
| Mean | 6.1% | 6.3% |
| Median | 5.1% | 5.6% |
| Interquartile 25% (IQ1) | 3.6% | 4.2% |
| Interquartile 75% (IQ3) | 7.3% | 6.7% |
| Interquartile Range (IQR) | 3.7% | 2.5% |
| Standard Deviation (Sample) | 3.9% | 3.3% |
| Standard Deviation (Population) | 3.9% | 3.3% |
Demographics Similar to Paraguayans and Moroccans by 4 or more Vehicles in Household
In terms of 4 or more vehicles in household, the demographic groups most similar to Paraguayans are Immigrants from Somalia (4.9%, a difference of 0.15%), Houma (4.9%, a difference of 0.54%), Menominee (5.0%, a difference of 0.72%), Immigrants from Serbia (5.0%, a difference of 1.7%), and Cypriot (5.0%, a difference of 1.8%). Similarly, the demographic groups most similar to Moroccans are Houma (4.9%, a difference of 0.010%), Immigrants from Somalia (4.9%, a difference of 0.38%), Menominee (5.0%, a difference of 1.3%), Immigrants from Serbia (5.0%, a difference of 2.2%), and Somali (5.0%, a difference of 2.3%).
| Demographics | Rating | Rank | 4 or more Vehicles in Household |
| Immigrants | Ghana | 0.1 /100 | #299 | Tragic 5.2% |
| Immigrants | Morocco | 0.0 /100 | #300 | Tragic 5.1% |
| Immigrants | Zaire | 0.0 /100 | #301 | Tragic 5.1% |
| Bahamians | 0.0 /100 | #302 | Tragic 5.1% |
| Immigrants | Greece | 0.0 /100 | #303 | Tragic 5.1% |
| Cypriots | 0.0 /100 | #304 | Tragic 5.0% |
| Somalis | 0.0 /100 | #305 | Tragic 5.0% |
| Immigrants | Serbia | 0.0 /100 | #306 | Tragic 5.0% |
| Menominee | 0.0 /100 | #307 | Tragic 5.0% |
| Paraguayans | 0.0 /100 | #308 | Tragic 4.9% |
| Immigrants | Somalia | 0.0 /100 | #309 | Tragic 4.9% |
| Moroccans | 0.0 /100 | #310 | Tragic 4.9% |
| Houma | 0.0 /100 | #311 | Tragic 4.9% |
| Albanians | 0.0 /100 | #312 | Tragic 4.8% |
| Immigrants | Israel | 0.0 /100 | #313 | Tragic 4.8% |
| Immigrants | West Indies | 0.0 /100 | #314 | Tragic 4.7% |
| Immigrants | Belarus | 0.0 /100 | #315 | Tragic 4.7% |
| Puerto Ricans | 0.0 /100 | #316 | Tragic 4.7% |
| U.S. Virgin Islanders | 0.0 /100 | #317 | Tragic 4.6% |
| Jamaicans | 0.0 /100 | #318 | Tragic 4.6% |
| Haitians | 0.0 /100 | #319 | Tragic 4.6% |