Immigrants from Kuwait vs Ethiopian 2 or more Vehicles in Household
COMPARE
Immigrants from Kuwait
Ethiopian
2 or more Vehicles in Household
2 or more Vehicles in Household Comparison
Immigrants from Kuwait
Ethiopians
55.8%
2 OR MORE VEHICLES IN HOUSEHOLD
70.2/ 100
METRIC RATING
157th/ 347
METRIC RANK
53.1%
2 OR MORE VEHICLES IN HOUSEHOLD
1.7/ 100
METRIC RATING
243rd/ 347
METRIC RANK
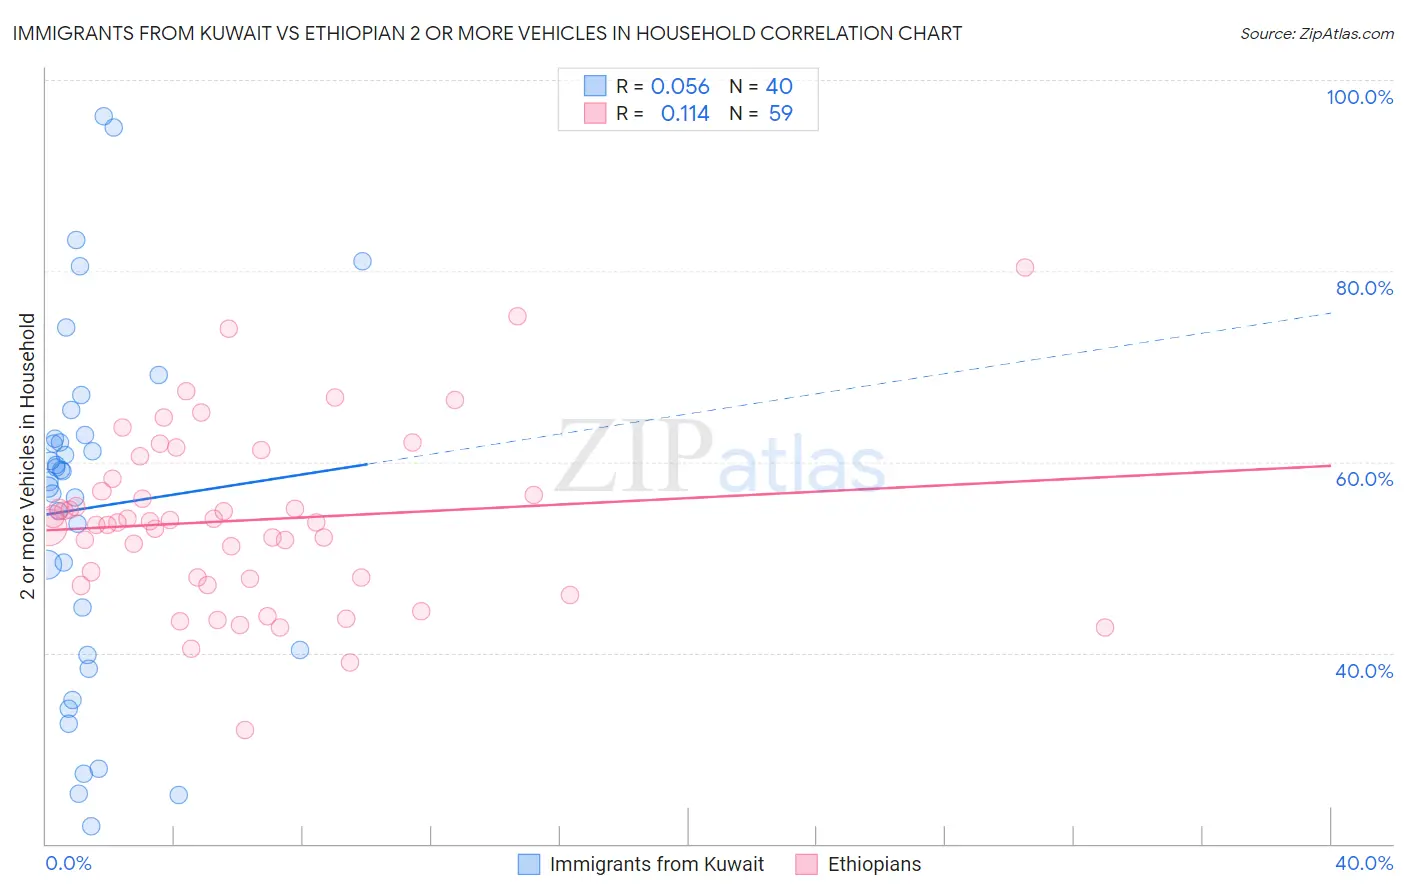
Immigrants from Kuwait vs Ethiopian 2 or more Vehicles in Household Correlation Chart
The statistical analysis conducted on geographies consisting of 136,894,640 people shows a slight positive correlation between the proportion of Immigrants from Kuwait and percentage of households with 2 or more vehicles available in the United States with a correlation coefficient (R) of 0.056 and weighted average of 55.8%. Similarly, the statistical analysis conducted on geographies consisting of 223,123,508 people shows a poor positive correlation between the proportion of Ethiopians and percentage of households with 2 or more vehicles available in the United States with a correlation coefficient (R) of 0.114 and weighted average of 53.1%, a difference of 5.1%.
2 or more Vehicles in Household Correlation Summary
| Measurement | Immigrants from Kuwait | Ethiopian |
| Minimum | 21.8% | 31.9% |
| Maximum | 96.2% | 80.4% |
| Range | 74.4% | 48.5% |
| Mean | 55.2% | 53.9% |
| Median | 58.5% | 53.7% |
| Interquartile 25% (IQ1) | 40.0% | 47.7% |
| Interquartile 75% (IQ3) | 62.6% | 58.3% |
| Interquartile Range (IQR) | 22.7% | 10.5% |
| Standard Deviation (Sample) | 18.4% | 9.1% |
| Standard Deviation (Population) | 18.2% | 9.1% |
Similar Demographics by 2 or more Vehicles in Household
Demographics Similar to Immigrants from Kuwait by 2 or more Vehicles in Household
In terms of 2 or more vehicles in household, the demographic groups most similar to Immigrants from Kuwait are Immigrants from Lithuania (55.8%, a difference of 0.010%), Ukrainian (55.8%, a difference of 0.030%), Immigrants from Venezuela (55.8%, a difference of 0.030%), Lumbee (55.9%, a difference of 0.080%), and Tlingit-Haida (55.8%, a difference of 0.080%).
| Demographics | Rating | Rank | 2 or more Vehicles in Household |
| Nicaraguans | 79.9 /100 | #150 | Good 56.1% |
| Immigrants | Northern Europe | 78.7 /100 | #151 | Good 56.1% |
| Immigrants | Pakistan | 78.1 /100 | #152 | Good 56.1% |
| Lumbee | 71.9 /100 | #153 | Good 55.9% |
| Ukrainians | 70.8 /100 | #154 | Good 55.8% |
| Immigrants | Venezuela | 70.7 /100 | #155 | Good 55.8% |
| Immigrants | Lithuania | 70.4 /100 | #156 | Good 55.8% |
| Immigrants | Kuwait | 70.2 /100 | #157 | Good 55.8% |
| Tlingit-Haida | 68.5 /100 | #158 | Good 55.8% |
| Paiute | 68.0 /100 | #159 | Good 55.8% |
| Crow | 67.0 /100 | #160 | Good 55.7% |
| Colville | 61.1 /100 | #161 | Good 55.6% |
| German Russians | 60.9 /100 | #162 | Good 55.6% |
| Immigrants | Zimbabwe | 60.2 /100 | #163 | Good 55.6% |
| Dutch West Indians | 59.8 /100 | #164 | Average 55.6% |
Demographics Similar to Ethiopians by 2 or more Vehicles in Household
In terms of 2 or more vehicles in household, the demographic groups most similar to Ethiopians are Indian (Asian) (53.1%, a difference of 0.040%), Immigrants from Ethiopia (53.0%, a difference of 0.16%), Immigrants from Eastern Asia (53.2%, a difference of 0.19%), Immigrants from Sierra Leone (53.2%, a difference of 0.20%), and Immigrants from Europe (53.2%, a difference of 0.23%).
| Demographics | Rating | Rank | 2 or more Vehicles in Household |
| Indonesians | 2.7 /100 | #236 | Tragic 53.4% |
| Macedonians | 2.4 /100 | #237 | Tragic 53.3% |
| Immigrants | Armenia | 2.3 /100 | #238 | Tragic 53.3% |
| Cambodians | 2.3 /100 | #239 | Tragic 53.3% |
| Immigrants | Europe | 2.1 /100 | #240 | Tragic 53.2% |
| Immigrants | Sierra Leone | 2.1 /100 | #241 | Tragic 53.2% |
| Immigrants | Eastern Asia | 2.1 /100 | #242 | Tragic 53.2% |
| Ethiopians | 1.7 /100 | #243 | Tragic 53.1% |
| Indians (Asian) | 1.7 /100 | #244 | Tragic 53.1% |
| Immigrants | Ethiopia | 1.5 /100 | #245 | Tragic 53.0% |
| Immigrants | Nigeria | 1.2 /100 | #246 | Tragic 52.9% |
| Sierra Leoneans | 1.2 /100 | #247 | Tragic 52.9% |
| Colombians | 1.1 /100 | #248 | Tragic 52.9% |
| Immigrants | Brazil | 1.0 /100 | #249 | Tragic 52.8% |
| Mongolians | 1.0 /100 | #250 | Tragic 52.8% |