Immigrants from Kuwait vs Immigrants from Western Europe 2 or more Vehicles in Household
COMPARE
Immigrants from Kuwait
Immigrants from Western Europe
2 or more Vehicles in Household
2 or more Vehicles in Household Comparison
Immigrants from Kuwait
Immigrants from Western Europe
55.8%
2 OR MORE VEHICLES IN HOUSEHOLD
70.2/ 100
METRIC RATING
157th/ 347
METRIC RANK
55.4%
2 OR MORE VEHICLES IN HOUSEHOLD
51.4/ 100
METRIC RATING
173rd/ 347
METRIC RANK
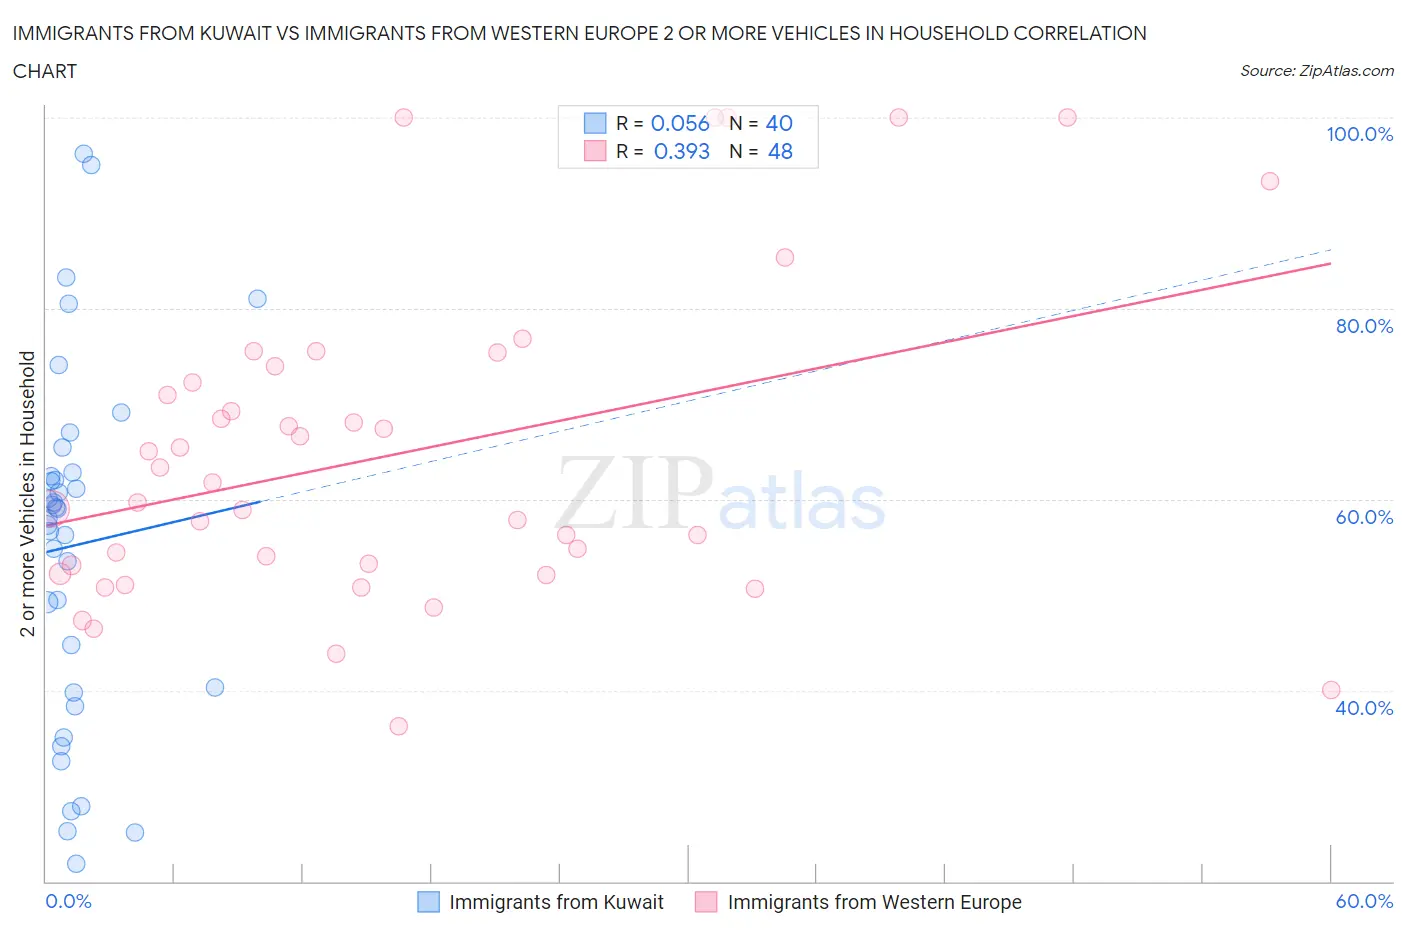
Immigrants from Kuwait vs Immigrants from Western Europe 2 or more Vehicles in Household Correlation Chart
The statistical analysis conducted on geographies consisting of 136,894,640 people shows a slight positive correlation between the proportion of Immigrants from Kuwait and percentage of households with 2 or more vehicles available in the United States with a correlation coefficient (R) of 0.056 and weighted average of 55.8%. Similarly, the statistical analysis conducted on geographies consisting of 493,846,859 people shows a mild positive correlation between the proportion of Immigrants from Western Europe and percentage of households with 2 or more vehicles available in the United States with a correlation coefficient (R) of 0.393 and weighted average of 55.4%, a difference of 0.80%.
2 or more Vehicles in Household Correlation Summary
| Measurement | Immigrants from Kuwait | Immigrants from Western Europe |
| Minimum | 21.8% | 36.3% |
| Maximum | 96.2% | 100.0% |
| Range | 74.4% | 63.7% |
| Mean | 55.2% | 64.7% |
| Median | 58.5% | 60.8% |
| Interquartile 25% (IQ1) | 40.0% | 52.7% |
| Interquartile 75% (IQ3) | 62.6% | 73.1% |
| Interquartile Range (IQR) | 22.7% | 20.5% |
| Standard Deviation (Sample) | 18.4% | 16.6% |
| Standard Deviation (Population) | 18.2% | 16.4% |
Demographics Similar to Immigrants from Kuwait and Immigrants from Western Europe by 2 or more Vehicles in Household
In terms of 2 or more vehicles in household, the demographic groups most similar to Immigrants from Kuwait are Immigrants from Lithuania (55.8%, a difference of 0.010%), Immigrants from Venezuela (55.8%, a difference of 0.030%), Tlingit-Haida (55.8%, a difference of 0.080%), Paiute (55.8%, a difference of 0.10%), and Crow (55.7%, a difference of 0.14%). Similarly, the demographic groups most similar to Immigrants from Western Europe are Immigrants from Nicaragua (55.4%, a difference of 0.010%), Navajo (55.3%, a difference of 0.050%), Immigrants from Denmark (55.3%, a difference of 0.080%), Immigrants from Costa Rica (55.4%, a difference of 0.12%), and Romanian (55.5%, a difference of 0.18%).
| Demographics | Rating | Rank | 2 or more Vehicles in Household |
| Immigrants | Venezuela | 70.7 /100 | #155 | Good 55.8% |
| Immigrants | Lithuania | 70.4 /100 | #156 | Good 55.8% |
| Immigrants | Kuwait | 70.2 /100 | #157 | Good 55.8% |
| Tlingit-Haida | 68.5 /100 | #158 | Good 55.8% |
| Paiute | 68.0 /100 | #159 | Good 55.8% |
| Crow | 67.0 /100 | #160 | Good 55.7% |
| Colville | 61.1 /100 | #161 | Good 55.6% |
| German Russians | 60.9 /100 | #162 | Good 55.6% |
| Immigrants | Zimbabwe | 60.2 /100 | #163 | Good 55.6% |
| Dutch West Indians | 59.8 /100 | #164 | Average 55.6% |
| Immigrants | El Salvador | 59.4 /100 | #165 | Average 55.6% |
| Immigrants | Sri Lanka | 58.3 /100 | #166 | Average 55.5% |
| Kenyans | 58.1 /100 | #167 | Average 55.5% |
| French American Indians | 56.7 /100 | #168 | Average 55.5% |
| Immigrants | Austria | 56.3 /100 | #169 | Average 55.5% |
| Romanians | 55.8 /100 | #170 | Average 55.5% |
| Immigrants | Costa Rica | 54.4 /100 | #171 | Average 55.4% |
| Immigrants | Nicaragua | 51.6 /100 | #172 | Average 55.4% |
| Immigrants | Western Europe | 51.4 /100 | #173 | Average 55.4% |
| Navajo | 50.0 /100 | #174 | Average 55.3% |
| Immigrants | Denmark | 49.4 /100 | #175 | Average 55.3% |