Immigrants from Jordan vs Costa Rican 1 or more Vehicles in Household

COMPARE

Immigrants from Jordan
Race
Ancestry
AfghanAfricanAlaska NativeAlaskan AthabascanAlbanianAleutAlsatianAmericanApacheArabArapahoArgentineanArmenianAssyrian/Chaldean/SyriacAustralianAustrianBahamianBangladeshiBarbadianBasqueBelgianBelizeanBermudanBhutaneseBlackfeetBolivianBrazilianBritishBritish West IndianBulgarianBurmeseCajunCambodianCanadianCape VerdeanCarpatho RusynCelticCentral AmericanCentral American IndianCherokeeCheyenneChickasawChileanChineseChippewaChoctawColombianColvilleComancheCreeCreekCroatianCrowCubanCypriotCzechCzechoslovakianDanishDelawareDominicanDutchDutch West IndianEastern EuropeanEcuadorianEgyptianEnglishEstonianEthiopianEuropeanFijianFilipinoFinnishFrenchFrench American IndianFrench CanadianGermanGerman RussianGhanaianGreekGuamanian/ChamorroGuatemalanGuyaneseHaitianHmongHonduranHopiHoumaHungarianIcelanderIndian (Asian)IndonesianInupiatIranianIraqiIrishIroquoisIsraeliItalianJamaicanJapaneseJordanianKenyanKiowaKoreanLaotianLatvianLebaneseLiberianLithuanianLumbeeLuxembourgerMacedonianMalaysianMalteseMarshalleseMenomineeMexicanMexican American IndianMongolianMoroccanNative HawaiianNavajoNepaleseNew ZealanderNicaraguanNigerianNorthern EuropeanNorwegianOkinawanOsageOttawaPaiutePakistaniPalestinianPanamanianParaguayanPennsylvania GermanPeruvianPimaPolishPortuguesePotawatomiPuebloPuerto RicanPuget Sound SalishRomanianRussianSalvadoranSamoanScandinavianScotch-IrishScottishSeminoleSenegaleseSerbianShoshoneSierra LeoneanSiouxSlavicSlovakSloveneSomaliSouth AfricanSouth AmericanSouth American IndianSoviet UnionSpaniardSpanishSpanish AmericanSpanish American IndianSri LankanSubsaharan AfricanSudaneseSwedishSwissSyrianTaiwaneseThaiTlingit-HaidaTohono O'OdhamTonganTrinidadian and TobagonianTsimshianTurkishU.S. Virgin IslanderUgandanUkrainianUruguayanUteVenezuelanVietnameseWelshWest IndianYakamaYaquiYugoslavianYumanYup'ikZimbabwean
Immigration
NonimmigrantsImmigrantsAfghanistanAfricaAlbaniaArgentinaArmeniaAsiaAustraliaAustriaBahamasBangladeshBarbadosBelarusBelgiumBelizeBoliviaBosnia and HerzegovinaBrazilBulgariaBurma/MyanmarCabo VerdeCambodiaCameroonCanadaCaribbeanCentral AmericaChileChinaColombiaCongoCosta RicaCroatiaCubaCzechoslovakiaDenmarkDominicaDominican RepublicEastern AfricaEastern AsiaEastern EuropeEcuadorEgyptEl SalvadorEnglandEritreaEthiopiaEuropeFijiFranceGermanyGhanaGreeceGrenadaGuatemalaGuyanaHaitiHondurasHong KongHungaryIndiaIndonesiaIranIraqIrelandIsraelItalyJamaicaJapanJordanKazakhstanKenyaKoreaKuwaitLaosLatin AmericaLatviaLebanonLiberiaLithuaniaMalaysiaMexicoMicronesiaMiddle AfricaMoldovaMoroccoNepalNetherlandsNicaraguaNigeriaNorth AmericaNorth MacedoniaNorthern AfricaNorthern EuropeNorwayOceaniaPakistanPanamaPeruPhilippinesPolandPortugalRomaniaRussiaSaudi ArabiaScotlandSenegalSerbiaSierra LeoneSingaporeSomaliaSouth AfricaSouth AmericaSouth Central AsiaSouth Eastern AsiaSouthern EuropeSpainSri LankaSt. Vincent and the GrenadinesSudanSwedenSwitzerlandSyriaTaiwanThailandTrinidad and TobagoTurkeyUgandaUkraineUruguayUzbekistanVenezuelaVietnamWest IndiesWestern AfricaWestern AsiaWestern EuropeYemenZaireZimbabweAzores
Costa Rican
Race
Ancestry
AfghanAfricanAlaska NativeAlaskan AthabascanAlbanianAleutAlsatianAmericanApacheArabArapahoArgentineanArmenianAssyrian/Chaldean/SyriacAustralianAustrianBahamianBangladeshiBarbadianBasqueBelgianBelizeanBermudanBhutaneseBlackfeetBolivianBrazilianBritishBritish West IndianBulgarianBurmeseCajunCambodianCanadianCape VerdeanCarpatho RusynCelticCentral AmericanCentral American IndianCherokeeCheyenneChickasawChileanChineseChippewaChoctawColombianColvilleComancheCosta RicanCreeCreekCroatianCrowCubanCypriotCzechCzechoslovakianDanishDelawareDominicanDutchDutch West IndianEastern EuropeanEcuadorianEgyptianEnglishEstonianEthiopianEuropeanFijianFilipinoFinnishFrenchFrench American IndianFrench CanadianGermanGerman RussianGhanaianGreekGuamanian/ChamorroGuatemalanGuyaneseHaitianHmongHonduranHopiHoumaHungarianIcelanderIndian (Asian)IndonesianInupiatIranianIraqiIrishIroquoisIsraeliItalianJamaicanJapaneseJordanianKenyanKiowaKoreanLaotianLatvianLebaneseLiberianLithuanianLumbeeLuxembourgerMacedonianMalaysianMalteseMarshalleseMenomineeMexicanMexican American IndianMongolianMoroccanNative HawaiianNavajoNepaleseNew ZealanderNicaraguanNigerianNorthern EuropeanNorwegianOkinawanOsageOttawaPaiutePakistaniPalestinianPanamanianParaguayanPennsylvania GermanPeruvianPimaPolishPortuguesePotawatomiPuebloPuerto RicanPuget Sound SalishRomanianRussianSalvadoranSamoanScandinavianScotch-IrishScottishSeminoleSenegaleseSerbianShoshoneSierra LeoneanSiouxSlavicSlovakSloveneSomaliSouth AfricanSouth AmericanSouth American IndianSoviet UnionSpaniardSpanishSpanish AmericanSpanish American IndianSri LankanSubsaharan AfricanSudaneseSwedishSwissSyrianTaiwaneseThaiTlingit-HaidaTohono O'OdhamTonganTrinidadian and TobagonianTsimshianTurkishU.S. Virgin IslanderUgandanUkrainianUruguayanUteVenezuelanVietnameseWelshWest IndianYakamaYaquiYugoslavianYumanYup'ikZimbabwean
Immigration
NonimmigrantsImmigrantsAfghanistanAfricaAlbaniaArgentinaArmeniaAsiaAustraliaAustriaBahamasBangladeshBarbadosBelarusBelgiumBelizeBoliviaBosnia and HerzegovinaBrazilBulgariaBurma/MyanmarCabo VerdeCambodiaCameroonCanadaCaribbeanCentral AmericaChileChinaColombiaCongoCosta RicaCroatiaCubaCzechoslovakiaDenmarkDominicaDominican RepublicEastern AfricaEastern AsiaEastern EuropeEcuadorEgyptEl SalvadorEnglandEritreaEthiopiaEuropeFijiFranceGermanyGhanaGreeceGrenadaGuatemalaGuyanaHaitiHondurasHong KongHungaryIndiaIndonesiaIranIraqIrelandIsraelItalyJamaicaJapanKazakhstanKenyaKoreaKuwaitLaosLatin AmericaLatviaLebanonLiberiaLithuaniaMalaysiaMexicoMicronesiaMiddle AfricaMoldovaMoroccoNepalNetherlandsNicaraguaNigeriaNorth AmericaNorth MacedoniaNorthern AfricaNorthern EuropeNorwayOceaniaPakistanPanamaPeruPhilippinesPolandPortugalRomaniaRussiaSaudi ArabiaScotlandSenegalSerbiaSierra LeoneSingaporeSomaliaSouth AfricaSouth AmericaSouth Central AsiaSouth Eastern AsiaSouthern EuropeSpainSri LankaSt. Vincent and the GrenadinesSudanSwedenSwitzerlandSyriaTaiwanThailandTrinidad and TobagoTurkeyUgandaUkraineUruguayUzbekistanVenezuelaVietnamWest IndiesWestern AfricaWestern AsiaWestern EuropeYemenZaireZimbabweAzores
1 or more Vehicles in Household
Income
Poverty
Unemployment
Labor Participation
Family Structure
Vehicle Availability
Education Level
Disability

1 or more Vehicles in Household Comparison

Immigrants from Jordan

Costa Ricans

Exceptional
Exceptional
91.4%
1 OR MORE VEHICLES IN HOUSEHOLD
99.2/ 100
METRIC RATING
91st/ 347
METRIC RANK
90.5%
1 OR MORE VEHICLES IN HOUSEHOLD
92.0/ 100
METRIC RATING
122nd/ 347
METRIC RANK

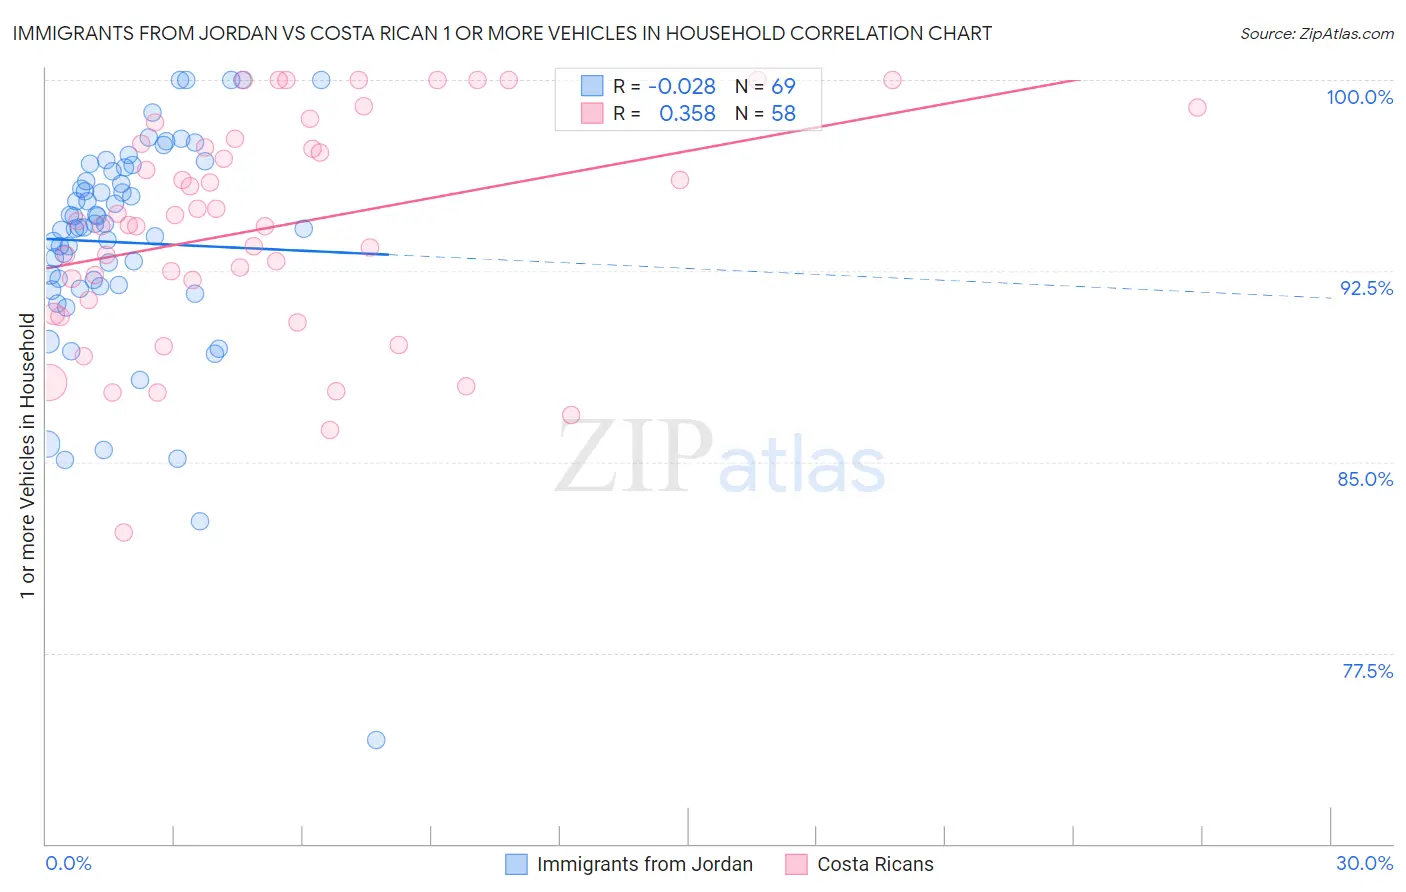
Immigrants from Jordan vs Costa Rican 1 or more Vehicles in Household Correlation Chart

The statistical analysis conducted on geographies consisting of 181,238,017 people shows no correlation between the proportion of Immigrants from Jordan and percentage of households with 1 or more vehicles available in the United States with a correlation coefficient (R) of -0.028 and weighted average of 91.4%. Similarly, the statistical analysis conducted on geographies consisting of 253,487,388 people shows a mild positive correlation between the proportion of Costa Ricans and percentage of households with 1 or more vehicles available in the United States with a correlation coefficient (R) of 0.358 and weighted average of 90.5%, a difference of 0.93%.
Immigrants from Jordan vs Costa Rican 1 or more Vehicles in Household

1 or more Vehicles in Household Correlation Summary

MeasurementImmigrants from JordanCosta Rican
Minimum74.1%82.2%
Maximum100.0%100.0%
Range25.9%17.8%
Mean93.6%94.2%
Median94.2%94.4%
Interquartile 25% (IQ1)91.9%91.3%
Interquartile 75% (IQ3)96.5%97.5%
Interquartile Range (IQR)4.5%6.2%
Standard Deviation (Sample)4.4%4.3%
Standard Deviation (Population)4.4%4.3%

Similar Demographics by 1 or more Vehicles in Household

Demographics Similar to Immigrants from Jordan by 1 or more Vehicles in Household

In terms of 1 or more vehicles in household, the demographic groups most similar to Immigrants from Jordan are Spanish American (91.4%, a difference of 0.0%), Bangladeshi (91.4%, a difference of 0.0%), Immigrants from Canada (91.4%, a difference of 0.0%), Immigrants from Germany (91.4%, a difference of 0.010%), and Bhutanese (91.4%, a difference of 0.010%).
DemographicsRating | Rank1 or more Vehicles in Household
Jordanians
99.3
/100
|
#84
Exceptional
91.4%
Tsimshian
99.3
/100
|
#85
Exceptional
91.4%
Osage
99.2
/100
|
#86
Exceptional
91.4%
Immigrants | Germany
99.2
/100
|
#87
Exceptional
91.4%
Spanish Americans
99.2
/100
|
#88
Exceptional
91.4%
Bangladeshis
99.2
/100
|
#89
Exceptional
91.4%
Immigrants | Canada
99.2
/100
|
#90
Exceptional
91.4%
Immigrants | Jordan
99.2
/100
|
#91
Exceptional
91.4%
Bhutanese
99.2
/100
|
#92
Exceptional
91.4%
Immigrants | North America
99.2
/100
|
#93
Exceptional
91.4%
Immigrants | Cuba
99.1
/100
|
#94
Exceptional
91.3%
Austrians
99.0
/100
|
#95
Exceptional
91.3%
Potawatomi
99.0
/100
|
#96
Exceptional
91.3%
Pakistanis
99.0
/100
|
#97
Exceptional
91.3%
Slavs
98.7
/100
|
#98
Exceptional
91.2%

Demographics Similar to Costa Ricans by 1 or more Vehicles in Household

In terms of 1 or more vehicles in household, the demographic groups most similar to Costa Ricans are Icelander (90.5%, a difference of 0.010%), Fijian (90.5%, a difference of 0.010%), Immigrants from Thailand (90.6%, a difference of 0.020%), Puget Sound Salish (90.5%, a difference of 0.020%), and Blackfeet (90.6%, a difference of 0.030%).
DemographicsRating | Rank1 or more Vehicles in Household
Serbians
94.3
/100
|
#115
Exceptional
90.7%
Chippewa
94.3
/100
|
#116
Exceptional
90.7%
Greeks
93.5
/100
|
#117
Exceptional
90.6%
Japanese
93.4
/100
|
#118
Exceptional
90.6%
Blackfeet
92.6
/100
|
#119
Exceptional
90.6%
Immigrants | Thailand
92.3
/100
|
#120
Exceptional
90.6%
Icelanders
92.1
/100
|
#121
Exceptional
90.5%
Costa Ricans
92.0
/100
|
#122
Exceptional
90.5%
Fijians
91.8
/100
|
#123
Exceptional
90.5%
Puget Sound Salish
91.5
/100
|
#124
Exceptional
90.5%
Immigrants | Korea
90.5
/100
|
#125
Exceptional
90.5%
Immigrants | Cameroon
89.4
/100
|
#126
Excellent
90.4%
Immigrants | Azores
89.1
/100
|
#127
Excellent
90.4%
Burmese
89.0
/100
|
#128
Excellent
90.4%
Marshallese
88.9
/100
|
#129
Excellent
90.4%