Immigrants from Jordan vs Immigrants from Southern Europe 1 or more Vehicles in Household
COMPARE
Immigrants from Jordan
Immigrants from Southern Europe
1 or more Vehicles in Household
1 or more Vehicles in Household Comparison
Immigrants from Jordan
Immigrants from Southern Europe
91.4%
1 OR MORE VEHICLES IN HOUSEHOLD
99.2/ 100
METRIC RATING
91st/ 347
METRIC RANK
87.1%
1 OR MORE VEHICLES IN HOUSEHOLD
0.1/ 100
METRIC RATING
278th/ 347
METRIC RANK
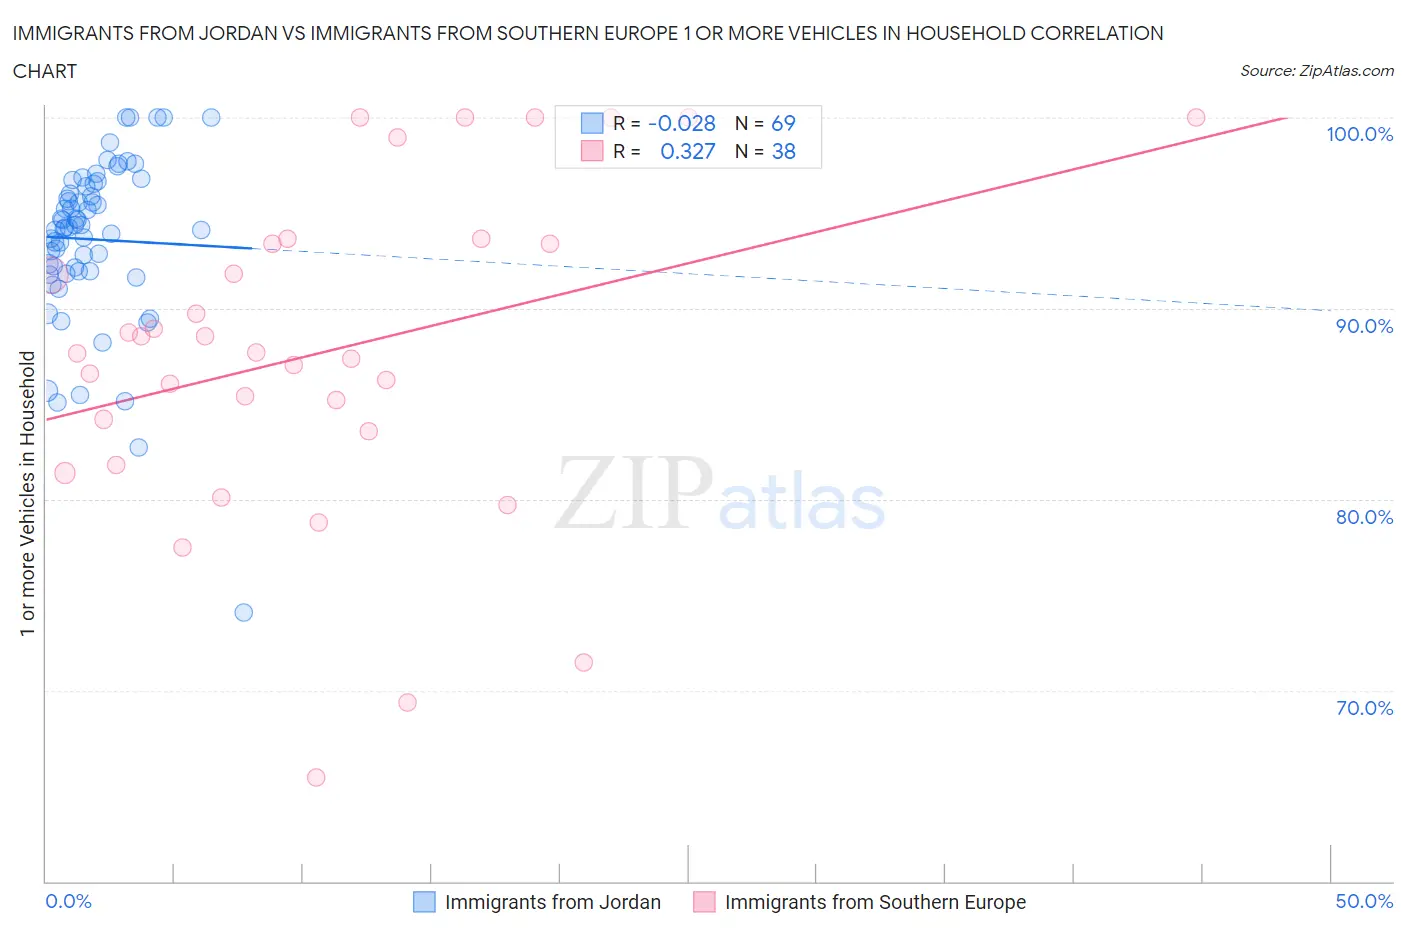
Immigrants from Jordan vs Immigrants from Southern Europe 1 or more Vehicles in Household Correlation Chart
The statistical analysis conducted on geographies consisting of 181,238,017 people shows no correlation between the proportion of Immigrants from Jordan and percentage of households with 1 or more vehicles available in the United States with a correlation coefficient (R) of -0.028 and weighted average of 91.4%. Similarly, the statistical analysis conducted on geographies consisting of 402,667,102 people shows a mild positive correlation between the proportion of Immigrants from Southern Europe and percentage of households with 1 or more vehicles available in the United States with a correlation coefficient (R) of 0.327 and weighted average of 87.1%, a difference of 5.0%.
1 or more Vehicles in Household Correlation Summary
| Measurement | Immigrants from Jordan | Immigrants from Southern Europe |
| Minimum | 74.1% | 65.4% |
| Maximum | 100.0% | 100.0% |
| Range | 25.9% | 34.6% |
| Mean | 93.6% | 87.7% |
| Median | 94.2% | 87.7% |
| Interquartile 25% (IQ1) | 91.9% | 83.6% |
| Interquartile 75% (IQ3) | 96.5% | 93.4% |
| Interquartile Range (IQR) | 4.5% | 9.8% |
| Standard Deviation (Sample) | 4.4% | 8.6% |
| Standard Deviation (Population) | 4.4% | 8.5% |
Similar Demographics by 1 or more Vehicles in Household
Demographics Similar to Immigrants from Jordan by 1 or more Vehicles in Household
In terms of 1 or more vehicles in household, the demographic groups most similar to Immigrants from Jordan are Spanish American (91.4%, a difference of 0.0%), Bangladeshi (91.4%, a difference of 0.0%), Immigrants from Canada (91.4%, a difference of 0.0%), Immigrants from Germany (91.4%, a difference of 0.010%), and Bhutanese (91.4%, a difference of 0.010%).
| Demographics | Rating | Rank | 1 or more Vehicles in Household |
| Jordanians | 99.3 /100 | #84 | Exceptional 91.4% |
| Tsimshian | 99.3 /100 | #85 | Exceptional 91.4% |
| Osage | 99.2 /100 | #86 | Exceptional 91.4% |
| Immigrants | Germany | 99.2 /100 | #87 | Exceptional 91.4% |
| Spanish Americans | 99.2 /100 | #88 | Exceptional 91.4% |
| Bangladeshis | 99.2 /100 | #89 | Exceptional 91.4% |
| Immigrants | Canada | 99.2 /100 | #90 | Exceptional 91.4% |
| Immigrants | Jordan | 99.2 /100 | #91 | Exceptional 91.4% |
| Bhutanese | 99.2 /100 | #92 | Exceptional 91.4% |
| Immigrants | North America | 99.2 /100 | #93 | Exceptional 91.4% |
| Immigrants | Cuba | 99.1 /100 | #94 | Exceptional 91.3% |
| Austrians | 99.0 /100 | #95 | Exceptional 91.3% |
| Potawatomi | 99.0 /100 | #96 | Exceptional 91.3% |
| Pakistanis | 99.0 /100 | #97 | Exceptional 91.3% |
| Slavs | 98.7 /100 | #98 | Exceptional 91.2% |
Demographics Similar to Immigrants from Southern Europe by 1 or more Vehicles in Household
In terms of 1 or more vehicles in household, the demographic groups most similar to Immigrants from Southern Europe are Immigrants from Albania (87.1%, a difference of 0.0%), Immigrants from Croatia (87.0%, a difference of 0.030%), Alsatian (87.1%, a difference of 0.040%), Immigrants from France (87.1%, a difference of 0.10%), and Mongolian (87.0%, a difference of 0.10%).
| Demographics | Rating | Rank | 1 or more Vehicles in Household |
| Bermudans | 0.2 /100 | #271 | Tragic 87.5% |
| Aleuts | 0.2 /100 | #272 | Tragic 87.5% |
| Immigrants | Northern Africa | 0.2 /100 | #273 | Tragic 87.4% |
| Immigrants | Morocco | 0.1 /100 | #274 | Tragic 87.4% |
| Immigrants | Singapore | 0.1 /100 | #275 | Tragic 87.2% |
| Immigrants | France | 0.1 /100 | #276 | Tragic 87.1% |
| Alsatians | 0.1 /100 | #277 | Tragic 87.1% |
| Immigrants | Southern Europe | 0.1 /100 | #278 | Tragic 87.1% |
| Immigrants | Albania | 0.1 /100 | #279 | Tragic 87.1% |
| Immigrants | Croatia | 0.0 /100 | #280 | Tragic 87.0% |
| Mongolians | 0.0 /100 | #281 | Tragic 87.0% |
| Colville | 0.0 /100 | #282 | Tragic 86.8% |
| Immigrants | Eastern Europe | 0.0 /100 | #283 | Tragic 86.7% |
| Central American Indians | 0.0 /100 | #284 | Tragic 86.7% |
| Immigrants | Kazakhstan | 0.0 /100 | #285 | Tragic 86.6% |