Immigrants from Jordan vs Albanian 1 or more Vehicles in Household
COMPARE
Immigrants from Jordan
Albanian
1 or more Vehicles in Household
1 or more Vehicles in Household Comparison
Immigrants from Jordan
Albanians
91.4%
1 OR MORE VEHICLES IN HOUSEHOLD
99.2/ 100
METRIC RATING
91st/ 347
METRIC RANK
84.4%
1 OR MORE VEHICLES IN HOUSEHOLD
0.0/ 100
METRIC RATING
314th/ 347
METRIC RANK
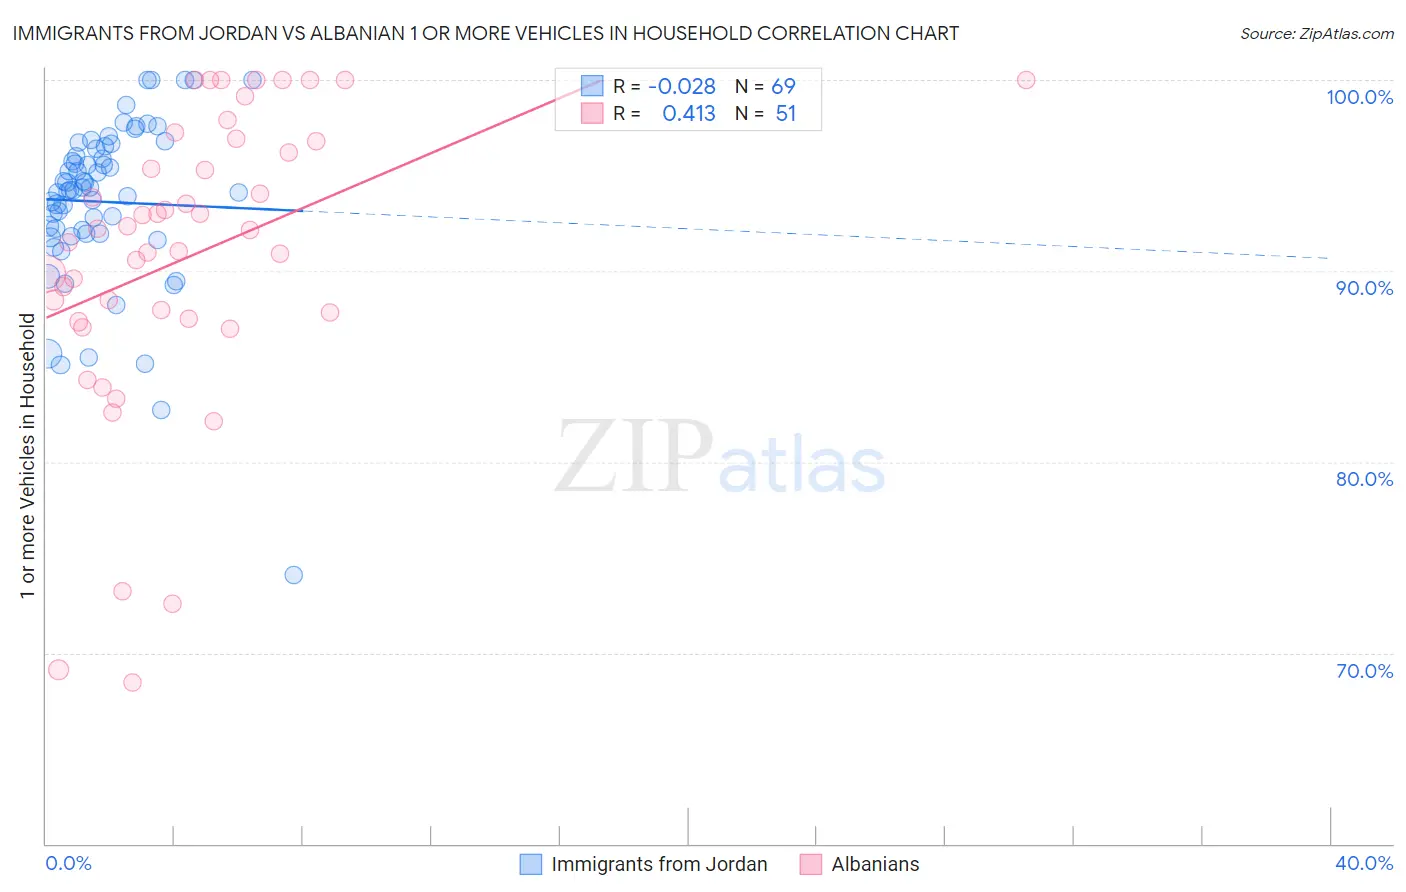
Immigrants from Jordan vs Albanian 1 or more Vehicles in Household Correlation Chart
The statistical analysis conducted on geographies consisting of 181,238,017 people shows no correlation between the proportion of Immigrants from Jordan and percentage of households with 1 or more vehicles available in the United States with a correlation coefficient (R) of -0.028 and weighted average of 91.4%. Similarly, the statistical analysis conducted on geographies consisting of 193,195,026 people shows a moderate positive correlation between the proportion of Albanians and percentage of households with 1 or more vehicles available in the United States with a correlation coefficient (R) of 0.413 and weighted average of 84.4%, a difference of 8.2%.
1 or more Vehicles in Household Correlation Summary
| Measurement | Immigrants from Jordan | Albanian |
| Minimum | 74.1% | 68.5% |
| Maximum | 100.0% | 100.0% |
| Range | 25.9% | 31.5% |
| Mean | 93.6% | 90.8% |
| Median | 94.2% | 92.1% |
| Interquartile 25% (IQ1) | 91.9% | 87.5% |
| Interquartile 75% (IQ3) | 96.5% | 96.8% |
| Interquartile Range (IQR) | 4.5% | 9.3% |
| Standard Deviation (Sample) | 4.4% | 7.8% |
| Standard Deviation (Population) | 4.4% | 7.7% |
Similar Demographics by 1 or more Vehicles in Household
Demographics Similar to Immigrants from Jordan by 1 or more Vehicles in Household
In terms of 1 or more vehicles in household, the demographic groups most similar to Immigrants from Jordan are Spanish American (91.4%, a difference of 0.0%), Bangladeshi (91.4%, a difference of 0.0%), Immigrants from Canada (91.4%, a difference of 0.0%), Immigrants from Germany (91.4%, a difference of 0.010%), and Bhutanese (91.4%, a difference of 0.010%).
| Demographics | Rating | Rank | 1 or more Vehicles in Household |
| Jordanians | 99.3 /100 | #84 | Exceptional 91.4% |
| Tsimshian | 99.3 /100 | #85 | Exceptional 91.4% |
| Osage | 99.2 /100 | #86 | Exceptional 91.4% |
| Immigrants | Germany | 99.2 /100 | #87 | Exceptional 91.4% |
| Spanish Americans | 99.2 /100 | #88 | Exceptional 91.4% |
| Bangladeshis | 99.2 /100 | #89 | Exceptional 91.4% |
| Immigrants | Canada | 99.2 /100 | #90 | Exceptional 91.4% |
| Immigrants | Jordan | 99.2 /100 | #91 | Exceptional 91.4% |
| Bhutanese | 99.2 /100 | #92 | Exceptional 91.4% |
| Immigrants | North America | 99.2 /100 | #93 | Exceptional 91.4% |
| Immigrants | Cuba | 99.1 /100 | #94 | Exceptional 91.3% |
| Austrians | 99.0 /100 | #95 | Exceptional 91.3% |
| Potawatomi | 99.0 /100 | #96 | Exceptional 91.3% |
| Pakistanis | 99.0 /100 | #97 | Exceptional 91.3% |
| Slavs | 98.7 /100 | #98 | Exceptional 91.2% |
Demographics Similar to Albanians by 1 or more Vehicles in Household
In terms of 1 or more vehicles in household, the demographic groups most similar to Albanians are Immigrants from Israel (84.5%, a difference of 0.070%), Cypriot (84.4%, a difference of 0.070%), Cape Verdean (84.5%, a difference of 0.090%), Puerto Rican (84.6%, a difference of 0.20%), and U.S. Virgin Islander (84.6%, a difference of 0.24%).
| Demographics | Rating | Rank | 1 or more Vehicles in Household |
| Tohono O'odham | 0.0 /100 | #307 | Tragic 84.7% |
| Immigrants | Belize | 0.0 /100 | #308 | Tragic 84.7% |
| Immigrants | Haiti | 0.0 /100 | #309 | Tragic 84.7% |
| U.S. Virgin Islanders | 0.0 /100 | #310 | Tragic 84.6% |
| Puerto Ricans | 0.0 /100 | #311 | Tragic 84.6% |
| Cape Verdeans | 0.0 /100 | #312 | Tragic 84.5% |
| Immigrants | Israel | 0.0 /100 | #313 | Tragic 84.5% |
| Albanians | 0.0 /100 | #314 | Tragic 84.4% |
| Cypriots | 0.0 /100 | #315 | Tragic 84.4% |
| Alaska Natives | 0.0 /100 | #316 | Tragic 83.8% |
| Ghanaians | 0.0 /100 | #317 | Tragic 83.6% |
| Immigrants | Ghana | 0.0 /100 | #318 | Tragic 83.4% |
| Immigrants | Belarus | 0.0 /100 | #319 | Tragic 83.3% |
| Soviet Union | 0.0 /100 | #320 | Tragic 82.7% |
| Jamaicans | 0.0 /100 | #321 | Tragic 82.1% |