Immigrants from Jordan vs Salvadoran In Labor Force | Age 45-54
COMPARE
Immigrants from Jordan
Salvadoran
In Labor Force | Age 45-54
In Labor Force | Age 45-54 Comparison
Immigrants from Jordan
Salvadorans
83.1%
IN LABOR FORCE | AGE 45-54
85.2/ 100
METRIC RATING
127th/ 347
METRIC RANK
82.0%
IN LABOR FORCE | AGE 45-54
1.7/ 100
METRIC RATING
234th/ 347
METRIC RANK
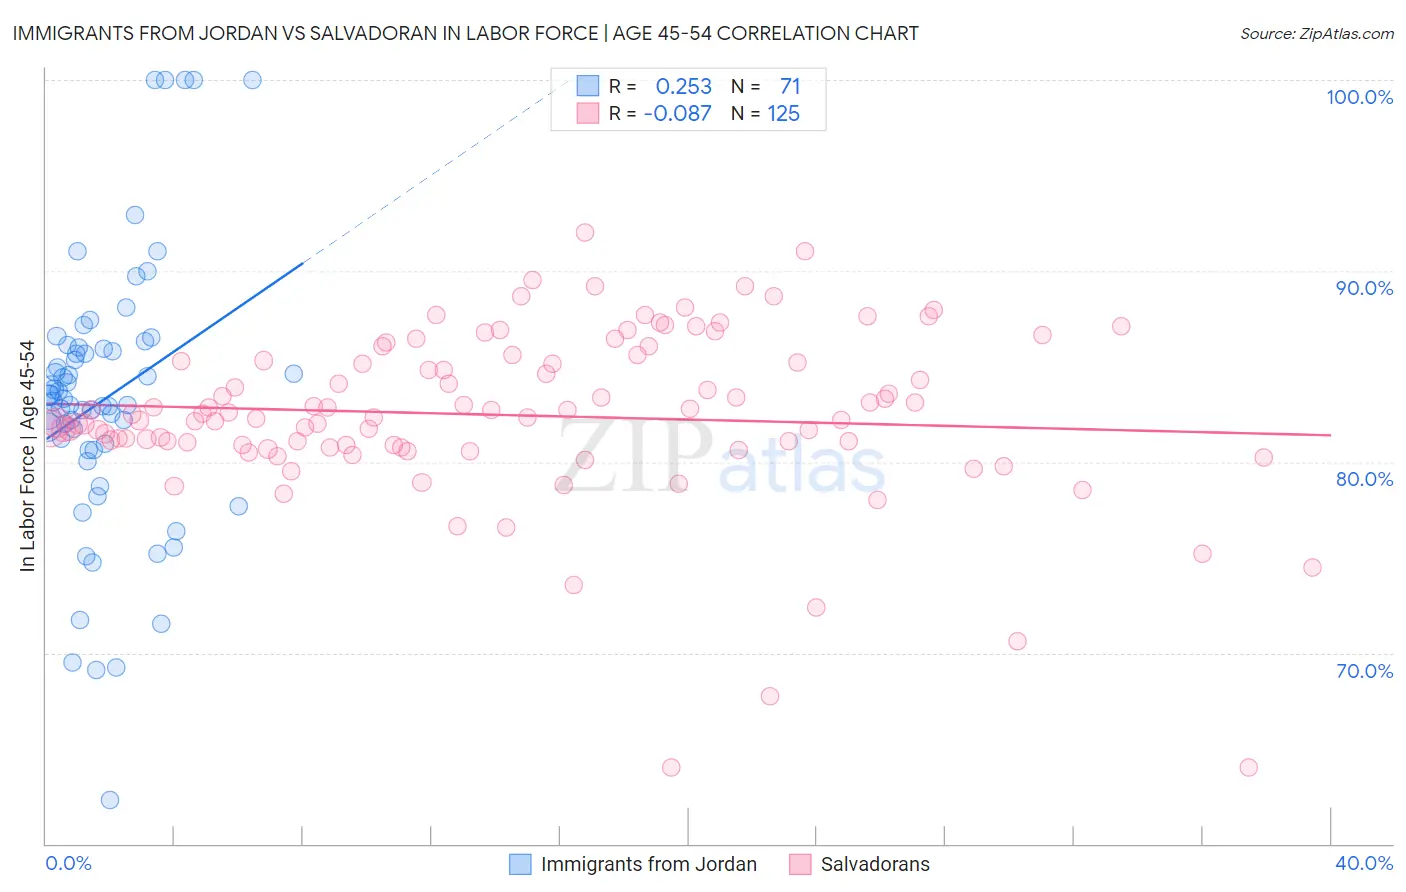
Immigrants from Jordan vs Salvadoran In Labor Force | Age 45-54 Correlation Chart
The statistical analysis conducted on geographies consisting of 181,248,316 people shows a weak positive correlation between the proportion of Immigrants from Jordan and labor force participation rate among population between the ages 45 and 54 in the United States with a correlation coefficient (R) of 0.253 and weighted average of 83.1%. Similarly, the statistical analysis conducted on geographies consisting of 398,682,111 people shows a slight negative correlation between the proportion of Salvadorans and labor force participation rate among population between the ages 45 and 54 in the United States with a correlation coefficient (R) of -0.087 and weighted average of 82.0%, a difference of 1.3%.
In Labor Force | Age 45-54 Correlation Summary
| Measurement | Immigrants from Jordan | Salvadoran |
| Minimum | 62.3% | 64.0% |
| Maximum | 100.0% | 92.0% |
| Range | 37.7% | 28.0% |
| Mean | 83.3% | 82.4% |
| Median | 83.3% | 82.4% |
| Interquartile 25% (IQ1) | 80.6% | 80.8% |
| Interquartile 75% (IQ3) | 86.0% | 85.3% |
| Interquartile Range (IQR) | 5.3% | 4.5% |
| Standard Deviation (Sample) | 7.2% | 4.5% |
| Standard Deviation (Population) | 7.1% | 4.5% |
Similar Demographics by In Labor Force | Age 45-54
Demographics Similar to Immigrants from Jordan by In Labor Force | Age 45-54
In terms of in labor force | age 45-54, the demographic groups most similar to Immigrants from Jordan are German (83.1%, a difference of 0.0%), Immigrants from Northern Europe (83.1%, a difference of 0.0%), Immigrants from Israel (83.1%, a difference of 0.010%), Immigrants from Belgium (83.1%, a difference of 0.020%), and Finnish (83.1%, a difference of 0.030%).
| Demographics | Rating | Rank | In Labor Force | Age 45-54 |
| Immigrants | Russia | 90.1 /100 | #120 | Exceptional 83.2% |
| Uruguayans | 89.4 /100 | #121 | Excellent 83.1% |
| Immigrants | Vietnam | 88.9 /100 | #122 | Excellent 83.1% |
| Tongans | 88.2 /100 | #123 | Excellent 83.1% |
| Bermudans | 88.0 /100 | #124 | Excellent 83.1% |
| Immigrants | Iran | 87.2 /100 | #125 | Excellent 83.1% |
| Immigrants | Belgium | 86.4 /100 | #126 | Excellent 83.1% |
| Immigrants | Jordan | 85.2 /100 | #127 | Excellent 83.1% |
| Germans | 85.1 /100 | #128 | Excellent 83.1% |
| Immigrants | Northern Europe | 85.1 /100 | #129 | Excellent 83.1% |
| Immigrants | Israel | 84.7 /100 | #130 | Excellent 83.1% |
| Finns | 83.3 /100 | #131 | Excellent 83.1% |
| Immigrants | Ukraine | 82.9 /100 | #132 | Excellent 83.0% |
| Liberians | 82.7 /100 | #133 | Excellent 83.0% |
| Sudanese | 82.0 /100 | #134 | Excellent 83.0% |
Demographics Similar to Salvadorans by In Labor Force | Age 45-54
In terms of in labor force | age 45-54, the demographic groups most similar to Salvadorans are Immigrants from Portugal (82.0%, a difference of 0.0%), Malaysian (82.0%, a difference of 0.0%), Immigrants from Senegal (82.0%, a difference of 0.010%), Jamaican (82.0%, a difference of 0.020%), and Immigrants from Burma/Myanmar (82.0%, a difference of 0.030%).
| Demographics | Rating | Rank | In Labor Force | Age 45-54 |
| Immigrants | Germany | 2.4 /100 | #227 | Tragic 82.1% |
| Cape Verdeans | 2.1 /100 | #228 | Tragic 82.1% |
| Immigrants | Burma/Myanmar | 1.9 /100 | #229 | Tragic 82.0% |
| Jamaicans | 1.8 /100 | #230 | Tragic 82.0% |
| Immigrants | Senegal | 1.7 /100 | #231 | Tragic 82.0% |
| Immigrants | Portugal | 1.7 /100 | #232 | Tragic 82.0% |
| Malaysians | 1.7 /100 | #233 | Tragic 82.0% |
| Salvadorans | 1.7 /100 | #234 | Tragic 82.0% |
| Sub-Saharan Africans | 1.2 /100 | #235 | Tragic 82.0% |
| Basques | 1.2 /100 | #236 | Tragic 82.0% |
| Immigrants | Trinidad and Tobago | 1.2 /100 | #237 | Tragic 82.0% |
| Trinidadians and Tobagonians | 1.1 /100 | #238 | Tragic 81.9% |
| Immigrants | Thailand | 1.0 /100 | #239 | Tragic 81.9% |
| Immigrants | El Salvador | 1.0 /100 | #240 | Tragic 81.9% |
| Immigrants | Cambodia | 0.8 /100 | #241 | Tragic 81.9% |