Immigrants from Jordan vs Navajo 1 or more Vehicles in Household
COMPARE
Immigrants from Jordan
Navajo
1 or more Vehicles in Household
1 or more Vehicles in Household Comparison
Immigrants from Jordan
Navajo
91.4%
1 OR MORE VEHICLES IN HOUSEHOLD
99.2/ 100
METRIC RATING
91st/ 347
METRIC RANK
90.8%
1 OR MORE VEHICLES IN HOUSEHOLD
95.8/ 100
METRIC RATING
111th/ 347
METRIC RANK
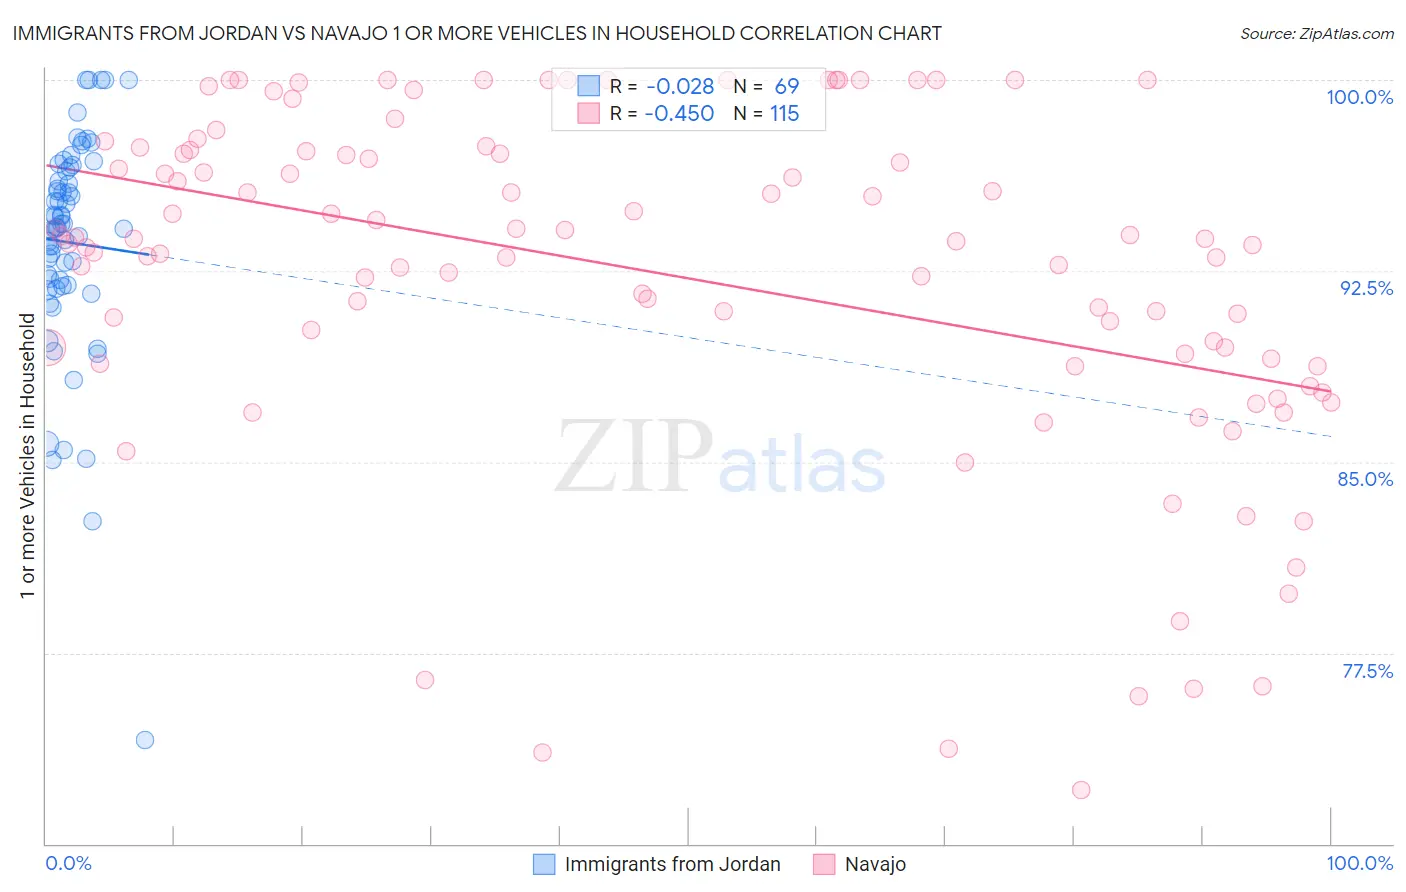
Immigrants from Jordan vs Navajo 1 or more Vehicles in Household Correlation Chart
The statistical analysis conducted on geographies consisting of 181,238,017 people shows no correlation between the proportion of Immigrants from Jordan and percentage of households with 1 or more vehicles available in the United States with a correlation coefficient (R) of -0.028 and weighted average of 91.4%. Similarly, the statistical analysis conducted on geographies consisting of 224,767,823 people shows a moderate negative correlation between the proportion of Navajo and percentage of households with 1 or more vehicles available in the United States with a correlation coefficient (R) of -0.450 and weighted average of 90.8%, a difference of 0.66%.
1 or more Vehicles in Household Correlation Summary
| Measurement | Immigrants from Jordan | Navajo |
| Minimum | 74.1% | 72.1% |
| Maximum | 100.0% | 100.0% |
| Range | 25.9% | 27.9% |
| Mean | 93.6% | 92.4% |
| Median | 94.2% | 93.7% |
| Interquartile 25% (IQ1) | 91.9% | 89.1% |
| Interquartile 75% (IQ3) | 96.5% | 97.2% |
| Interquartile Range (IQR) | 4.5% | 8.2% |
| Standard Deviation (Sample) | 4.4% | 6.7% |
| Standard Deviation (Population) | 4.4% | 6.7% |
Demographics Similar to Immigrants from Jordan and Navajo by 1 or more Vehicles in Household
In terms of 1 or more vehicles in household, the demographic groups most similar to Immigrants from Jordan are Bhutanese (91.4%, a difference of 0.010%), Immigrants from North America (91.4%, a difference of 0.010%), Immigrants from Cuba (91.3%, a difference of 0.070%), Austrian (91.3%, a difference of 0.080%), and Potawatomi (91.3%, a difference of 0.090%). Similarly, the demographic groups most similar to Navajo are Mexican American Indian (91.0%, a difference of 0.20%), Delaware (91.0%, a difference of 0.22%), Maltese (91.0%, a difference of 0.23%), Hispanic or Latino (91.0%, a difference of 0.23%), and Zimbabwean (91.0%, a difference of 0.25%).
| Demographics | Rating | Rank | 1 or more Vehicles in Household |
| Immigrants | Jordan | 99.2 /100 | #91 | Exceptional 91.4% |
| Bhutanese | 99.2 /100 | #92 | Exceptional 91.4% |
| Immigrants | North America | 99.2 /100 | #93 | Exceptional 91.4% |
| Immigrants | Cuba | 99.1 /100 | #94 | Exceptional 91.3% |
| Austrians | 99.0 /100 | #95 | Exceptional 91.3% |
| Potawatomi | 99.0 /100 | #96 | Exceptional 91.3% |
| Pakistanis | 99.0 /100 | #97 | Exceptional 91.3% |
| Slavs | 98.7 /100 | #98 | Exceptional 91.2% |
| Immigrants | Bolivia | 98.6 /100 | #99 | Exceptional 91.2% |
| Immigrants | Central America | 98.4 /100 | #100 | Exceptional 91.1% |
| Bulgarians | 98.4 /100 | #101 | Exceptional 91.1% |
| Seminole | 98.3 /100 | #102 | Exceptional 91.1% |
| Yugoslavians | 98.3 /100 | #103 | Exceptional 91.1% |
| Asians | 98.2 /100 | #104 | Exceptional 91.1% |
| Laotians | 98.0 /100 | #105 | Exceptional 91.0% |
| Zimbabweans | 97.7 /100 | #106 | Exceptional 91.0% |
| Maltese | 97.7 /100 | #107 | Exceptional 91.0% |
| Hispanics or Latinos | 97.6 /100 | #108 | Exceptional 91.0% |
| Delaware | 97.6 /100 | #109 | Exceptional 91.0% |
| Mexican American Indians | 97.4 /100 | #110 | Exceptional 91.0% |
| Navajo | 95.8 /100 | #111 | Exceptional 90.8% |