Immigrants from Jordan vs Immigrants from Liberia 1 or more Vehicles in Household

COMPARE

Immigrants from Jordan
Race
Ancestry
AfghanAfricanAlaska NativeAlaskan AthabascanAlbanianAleutAlsatianAmericanApacheArabArapahoArgentineanArmenianAssyrian/Chaldean/SyriacAustralianAustrianBahamianBangladeshiBarbadianBasqueBelgianBelizeanBermudanBhutaneseBlackfeetBolivianBrazilianBritishBritish West IndianBulgarianBurmeseCajunCambodianCanadianCape VerdeanCarpatho RusynCelticCentral AmericanCentral American IndianCherokeeCheyenneChickasawChileanChineseChippewaChoctawColombianColvilleComancheCosta RicanCreeCreekCroatianCrowCubanCypriotCzechCzechoslovakianDanishDelawareDominicanDutchDutch West IndianEastern EuropeanEcuadorianEgyptianEnglishEstonianEthiopianEuropeanFijianFilipinoFinnishFrenchFrench American IndianFrench CanadianGermanGerman RussianGhanaianGreekGuamanian/ChamorroGuatemalanGuyaneseHaitianHmongHonduranHopiHoumaHungarianIcelanderIndian (Asian)IndonesianInupiatIranianIraqiIrishIroquoisIsraeliItalianJamaicanJapaneseJordanianKenyanKiowaKoreanLaotianLatvianLebaneseLiberianLithuanianLumbeeLuxembourgerMacedonianMalaysianMalteseMarshalleseMenomineeMexicanMexican American IndianMongolianMoroccanNative HawaiianNavajoNepaleseNew ZealanderNicaraguanNigerianNorthern EuropeanNorwegianOkinawanOsageOttawaPaiutePakistaniPalestinianPanamanianParaguayanPennsylvania GermanPeruvianPimaPolishPortuguesePotawatomiPuebloPuerto RicanPuget Sound SalishRomanianRussianSalvadoranSamoanScandinavianScotch-IrishScottishSeminoleSenegaleseSerbianShoshoneSierra LeoneanSiouxSlavicSlovakSloveneSomaliSouth AfricanSouth AmericanSouth American IndianSoviet UnionSpaniardSpanishSpanish AmericanSpanish American IndianSri LankanSubsaharan AfricanSudaneseSwedishSwissSyrianTaiwaneseThaiTlingit-HaidaTohono O'OdhamTonganTrinidadian and TobagonianTsimshianTurkishU.S. Virgin IslanderUgandanUkrainianUruguayanUteVenezuelanVietnameseWelshWest IndianYakamaYaquiYugoslavianYumanYup'ikZimbabwean
Immigration
NonimmigrantsImmigrantsAfghanistanAfricaAlbaniaArgentinaArmeniaAsiaAustraliaAustriaBahamasBangladeshBarbadosBelarusBelgiumBelizeBoliviaBosnia and HerzegovinaBrazilBulgariaBurma/MyanmarCabo VerdeCambodiaCameroonCanadaCaribbeanCentral AmericaChileChinaColombiaCongoCosta RicaCroatiaCubaCzechoslovakiaDenmarkDominicaDominican RepublicEastern AfricaEastern AsiaEastern EuropeEcuadorEgyptEl SalvadorEnglandEritreaEthiopiaEuropeFijiFranceGermanyGhanaGreeceGrenadaGuatemalaGuyanaHaitiHondurasHong KongHungaryIndiaIndonesiaIranIraqIrelandIsraelItalyJamaicaJapanJordanKazakhstanKenyaKoreaKuwaitLaosLatin AmericaLatviaLebanonLithuaniaMalaysiaMexicoMicronesiaMiddle AfricaMoldovaMoroccoNepalNetherlandsNicaraguaNigeriaNorth AmericaNorth MacedoniaNorthern AfricaNorthern EuropeNorwayOceaniaPakistanPanamaPeruPhilippinesPolandPortugalRomaniaRussiaSaudi ArabiaScotlandSenegalSerbiaSierra LeoneSingaporeSomaliaSouth AfricaSouth AmericaSouth Central AsiaSouth Eastern AsiaSouthern EuropeSpainSri LankaSt. Vincent and the GrenadinesSudanSwedenSwitzerlandSyriaTaiwanThailandTrinidad and TobagoTurkeyUgandaUkraineUruguayUzbekistanVenezuelaVietnamWest IndiesWestern AfricaWestern AsiaWestern EuropeYemenZaireZimbabweAzores
Immigrants from Liberia
Race
Ancestry
AfghanAfricanAlaska NativeAlaskan AthabascanAlbanianAleutAlsatianAmericanApacheArabArapahoArgentineanArmenianAssyrian/Chaldean/SyriacAustralianAustrianBahamianBangladeshiBarbadianBasqueBelgianBelizeanBermudanBhutaneseBlackfeetBolivianBrazilianBritishBritish West IndianBulgarianBurmeseCajunCambodianCanadianCape VerdeanCarpatho RusynCelticCentral AmericanCentral American IndianCherokeeCheyenneChickasawChileanChineseChippewaChoctawColombianColvilleComancheCosta RicanCreeCreekCroatianCrowCubanCypriotCzechCzechoslovakianDanishDelawareDominicanDutchDutch West IndianEastern EuropeanEcuadorianEgyptianEnglishEstonianEthiopianEuropeanFijianFilipinoFinnishFrenchFrench American IndianFrench CanadianGermanGerman RussianGhanaianGreekGuamanian/ChamorroGuatemalanGuyaneseHaitianHmongHonduranHopiHoumaHungarianIcelanderIndian (Asian)IndonesianInupiatIranianIraqiIrishIroquoisIsraeliItalianJamaicanJapaneseJordanianKenyanKiowaKoreanLaotianLatvianLebaneseLiberianLithuanianLumbeeLuxembourgerMacedonianMalaysianMalteseMarshalleseMenomineeMexicanMexican American IndianMongolianMoroccanNative HawaiianNavajoNepaleseNew ZealanderNicaraguanNigerianNorthern EuropeanNorwegianOkinawanOsageOttawaPaiutePakistaniPalestinianPanamanianParaguayanPennsylvania GermanPeruvianPimaPolishPortuguesePotawatomiPuebloPuerto RicanPuget Sound SalishRomanianRussianSalvadoranSamoanScandinavianScotch-IrishScottishSeminoleSenegaleseSerbianShoshoneSierra LeoneanSiouxSlavicSlovakSloveneSomaliSouth AfricanSouth AmericanSouth American IndianSoviet UnionSpaniardSpanishSpanish AmericanSpanish American IndianSri LankanSubsaharan AfricanSudaneseSwedishSwissSyrianTaiwaneseThaiTlingit-HaidaTohono O'OdhamTonganTrinidadian and TobagonianTsimshianTurkishU.S. Virgin IslanderUgandanUkrainianUruguayanUteVenezuelanVietnameseWelshWest IndianYakamaYaquiYugoslavianYumanYup'ikZimbabwean
Immigration
NonimmigrantsImmigrantsAfghanistanAfricaAlbaniaArgentinaArmeniaAsiaAustraliaAustriaBahamasBangladeshBarbadosBelarusBelgiumBelizeBoliviaBosnia and HerzegovinaBrazilBulgariaBurma/MyanmarCabo VerdeCambodiaCameroonCanadaCaribbeanCentral AmericaChileChinaColombiaCongoCosta RicaCroatiaCubaCzechoslovakiaDenmarkDominicaDominican RepublicEastern AfricaEastern AsiaEastern EuropeEcuadorEgyptEl SalvadorEnglandEritreaEthiopiaEuropeFijiFranceGermanyGhanaGreeceGrenadaGuatemalaGuyanaHaitiHondurasHong KongHungaryIndiaIndonesiaIranIraqIrelandIsraelItalyJamaicaJapanKazakhstanKenyaKoreaKuwaitLaosLatin AmericaLatviaLebanonLiberiaLithuaniaMalaysiaMexicoMicronesiaMiddle AfricaMoldovaMoroccoNepalNetherlandsNicaraguaNigeriaNorth AmericaNorth MacedoniaNorthern AfricaNorthern EuropeNorwayOceaniaPakistanPanamaPeruPhilippinesPolandPortugalRomaniaRussiaSaudi ArabiaScotlandSenegalSerbiaSierra LeoneSingaporeSomaliaSouth AfricaSouth AmericaSouth Central AsiaSouth Eastern AsiaSouthern EuropeSpainSri LankaSt. Vincent and the GrenadinesSudanSwedenSwitzerlandSyriaTaiwanThailandTrinidad and TobagoTurkeyUgandaUkraineUruguayUzbekistanVenezuelaVietnamWest IndiesWestern AfricaWestern AsiaWestern EuropeYemenZaireZimbabweAzores
1 or more Vehicles in Household
Income
Poverty
Unemployment
Labor Participation
Family Structure
Vehicle Availability
Education Level
Disability

1 or more Vehicles in Household Comparison

Immigrants from Jordan

Immigrants from Liberia

Exceptional
Tragic
91.4%
1 OR MORE VEHICLES IN HOUSEHOLD
99.2/ 100
METRIC RATING
91st/ 347
METRIC RANK
87.8%
1 OR MORE VEHICLES IN HOUSEHOLD
0.4/ 100
METRIC RATING
264th/ 347
METRIC RANK

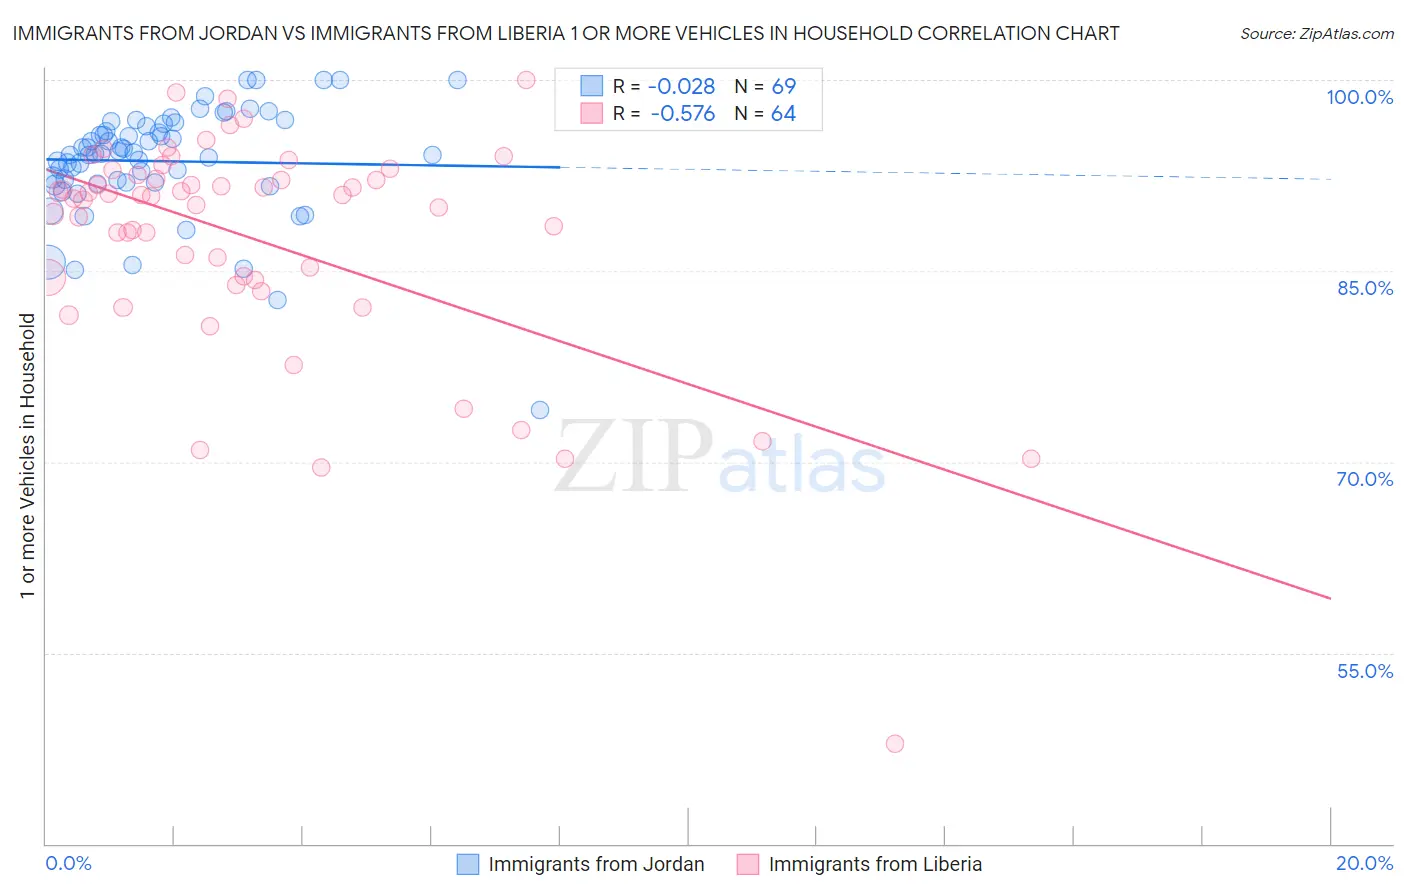
Immigrants from Jordan vs Immigrants from Liberia 1 or more Vehicles in Household Correlation Chart

The statistical analysis conducted on geographies consisting of 181,238,017 people shows no correlation between the proportion of Immigrants from Jordan and percentage of households with 1 or more vehicles available in the United States with a correlation coefficient (R) of -0.028 and weighted average of 91.4%. Similarly, the statistical analysis conducted on geographies consisting of 135,251,590 people shows a substantial negative correlation between the proportion of Immigrants from Liberia and percentage of households with 1 or more vehicles available in the United States with a correlation coefficient (R) of -0.576 and weighted average of 87.8%, a difference of 4.1%.
Immigrants from Jordan vs Immigrants from Liberia 1 or more Vehicles in Household

1 or more Vehicles in Household Correlation Summary

MeasurementImmigrants from JordanImmigrants from Liberia
Minimum74.1%47.9%
Maximum100.0%100.0%
Range25.9%52.1%
Mean93.6%87.5%
Median94.2%90.7%
Interquartile 25% (IQ1)91.9%84.4%
Interquartile 75% (IQ3)96.5%92.3%
Interquartile Range (IQR)4.5%8.0%
Standard Deviation (Sample)4.4%9.0%
Standard Deviation (Population)4.4%8.9%

Similar Demographics by 1 or more Vehicles in Household

Demographics Similar to Immigrants from Jordan by 1 or more Vehicles in Household

In terms of 1 or more vehicles in household, the demographic groups most similar to Immigrants from Jordan are Spanish American (91.4%, a difference of 0.0%), Bangladeshi (91.4%, a difference of 0.0%), Immigrants from Canada (91.4%, a difference of 0.0%), Immigrants from Germany (91.4%, a difference of 0.010%), and Bhutanese (91.4%, a difference of 0.010%).
DemographicsRating | Rank1 or more Vehicles in Household
Jordanians
99.3
/100
|
#84
Exceptional
91.4%
Tsimshian
99.3
/100
|
#85
Exceptional
91.4%
Osage
99.2
/100
|
#86
Exceptional
91.4%
Immigrants | Germany
99.2
/100
|
#87
Exceptional
91.4%
Spanish Americans
99.2
/100
|
#88
Exceptional
91.4%
Bangladeshis
99.2
/100
|
#89
Exceptional
91.4%
Immigrants | Canada
99.2
/100
|
#90
Exceptional
91.4%
Immigrants | Jordan
99.2
/100
|
#91
Exceptional
91.4%
Bhutanese
99.2
/100
|
#92
Exceptional
91.4%
Immigrants | North America
99.2
/100
|
#93
Exceptional
91.4%
Immigrants | Cuba
99.1
/100
|
#94
Exceptional
91.3%
Austrians
99.0
/100
|
#95
Exceptional
91.3%
Potawatomi
99.0
/100
|
#96
Exceptional
91.3%
Pakistanis
99.0
/100
|
#97
Exceptional
91.3%
Slavs
98.7
/100
|
#98
Exceptional
91.2%

Demographics Similar to Immigrants from Liberia by 1 or more Vehicles in Household

In terms of 1 or more vehicles in household, the demographic groups most similar to Immigrants from Liberia are Immigrants from Egypt (87.8%, a difference of 0.010%), African (87.8%, a difference of 0.020%), Subsaharan African (87.9%, a difference of 0.080%), Immigrants from Switzerland (87.9%, a difference of 0.11%), and Macedonian (87.9%, a difference of 0.15%).
DemographicsRating | Rank1 or more Vehicles in Household
Liberians
0.9
/100
|
#257
Tragic
88.0%
South American Indians
0.9
/100
|
#258
Tragic
88.0%
Nigerians
0.8
/100
|
#259
Tragic
88.0%
Macedonians
0.6
/100
|
#260
Tragic
87.9%
Immigrants | Switzerland
0.6
/100
|
#261
Tragic
87.9%
Sub-Saharan Africans
0.5
/100
|
#262
Tragic
87.9%
Immigrants | Egypt
0.5
/100
|
#263
Tragic
87.8%
Immigrants | Liberia
0.4
/100
|
#264
Tragic
87.8%
Africans
0.4
/100
|
#265
Tragic
87.8%
Israelis
0.3
/100
|
#266
Tragic
87.7%
Immigrants | Colombia
0.3
/100
|
#267
Tragic
87.6%
Immigrants | Europe
0.2
/100
|
#268
Tragic
87.6%
Immigrants | Africa
0.2
/100
|
#269
Tragic
87.6%
Panamanians
0.2
/100
|
#270
Tragic
87.5%
Bermudans
0.2
/100
|
#271
Tragic
87.5%