Immigrants from Jordan vs Delaware 1 or more Vehicles in Household
COMPARE
Immigrants from Jordan
Delaware
1 or more Vehicles in Household
1 or more Vehicles in Household Comparison
Immigrants from Jordan
Delaware
91.4%
1 OR MORE VEHICLES IN HOUSEHOLD
99.2/ 100
METRIC RATING
91st/ 347
METRIC RANK
91.0%
1 OR MORE VEHICLES IN HOUSEHOLD
97.6/ 100
METRIC RATING
109th/ 347
METRIC RANK
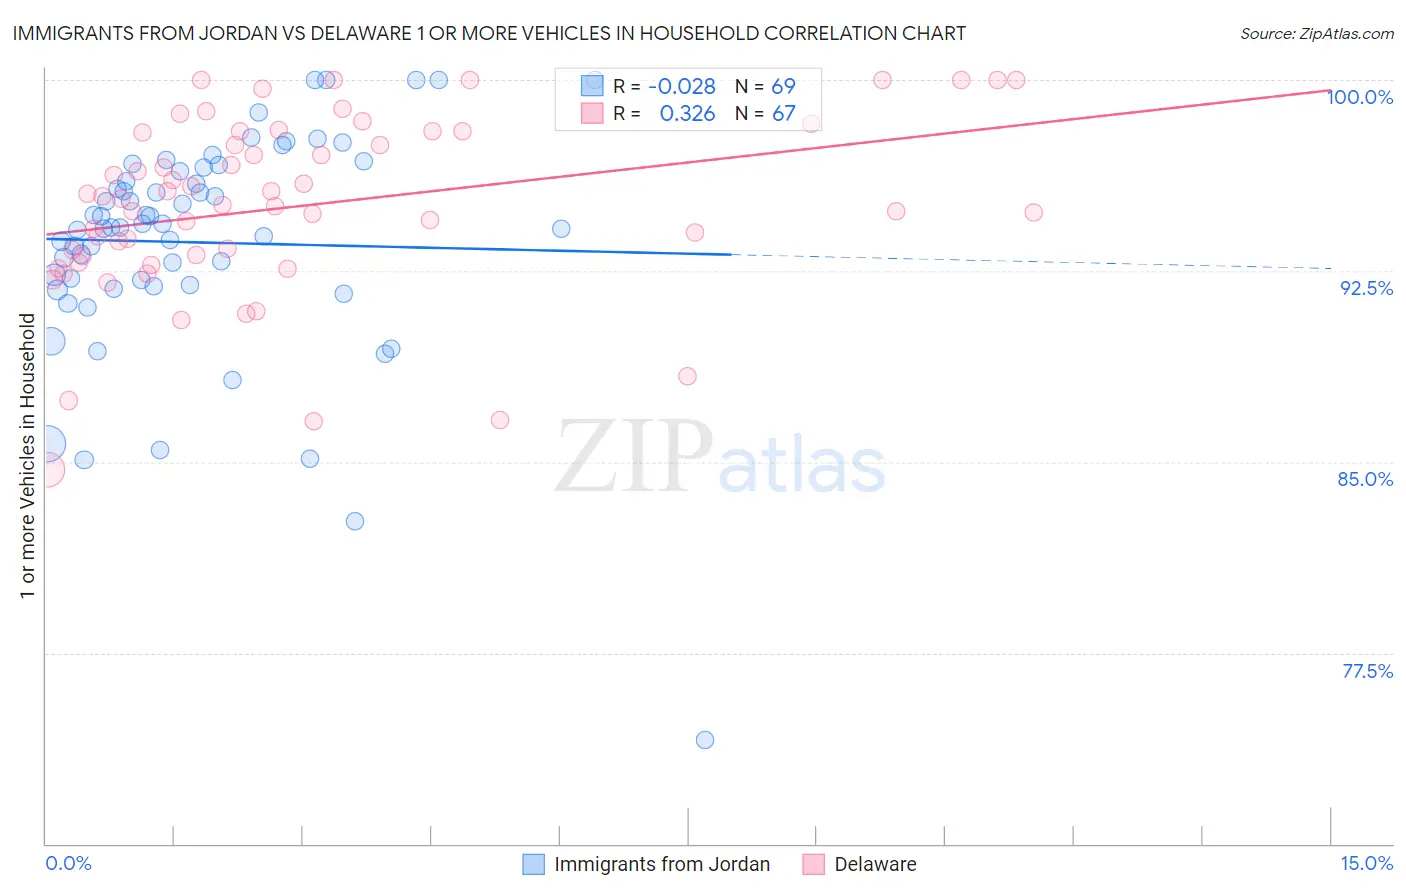
Immigrants from Jordan vs Delaware 1 or more Vehicles in Household Correlation Chart
The statistical analysis conducted on geographies consisting of 181,238,017 people shows no correlation between the proportion of Immigrants from Jordan and percentage of households with 1 or more vehicles available in the United States with a correlation coefficient (R) of -0.028 and weighted average of 91.4%. Similarly, the statistical analysis conducted on geographies consisting of 96,231,317 people shows a mild positive correlation between the proportion of Delaware and percentage of households with 1 or more vehicles available in the United States with a correlation coefficient (R) of 0.326 and weighted average of 91.0%, a difference of 0.43%.
1 or more Vehicles in Household Correlation Summary
| Measurement | Immigrants from Jordan | Delaware |
| Minimum | 74.1% | 84.7% |
| Maximum | 100.0% | 100.0% |
| Range | 25.9% | 15.3% |
| Mean | 93.6% | 95.1% |
| Median | 94.2% | 95.4% |
| Interquartile 25% (IQ1) | 91.9% | 93.1% |
| Interquartile 75% (IQ3) | 96.5% | 98.0% |
| Interquartile Range (IQR) | 4.5% | 4.9% |
| Standard Deviation (Sample) | 4.4% | 3.5% |
| Standard Deviation (Population) | 4.4% | 3.5% |
Demographics Similar to Immigrants from Jordan and Delaware by 1 or more Vehicles in Household
In terms of 1 or more vehicles in household, the demographic groups most similar to Immigrants from Jordan are Immigrants from Canada (91.4%, a difference of 0.0%), Bhutanese (91.4%, a difference of 0.010%), Immigrants from North America (91.4%, a difference of 0.010%), Immigrants from Cuba (91.3%, a difference of 0.070%), and Austrian (91.3%, a difference of 0.080%). Similarly, the demographic groups most similar to Delaware are Hispanic or Latino (91.0%, a difference of 0.0%), Maltese (91.0%, a difference of 0.010%), Zimbabwean (91.0%, a difference of 0.020%), Mexican American Indian (91.0%, a difference of 0.030%), and Laotian (91.0%, a difference of 0.070%).
| Demographics | Rating | Rank | 1 or more Vehicles in Household |
| Immigrants | Canada | 99.2 /100 | #90 | Exceptional 91.4% |
| Immigrants | Jordan | 99.2 /100 | #91 | Exceptional 91.4% |
| Bhutanese | 99.2 /100 | #92 | Exceptional 91.4% |
| Immigrants | North America | 99.2 /100 | #93 | Exceptional 91.4% |
| Immigrants | Cuba | 99.1 /100 | #94 | Exceptional 91.3% |
| Austrians | 99.0 /100 | #95 | Exceptional 91.3% |
| Potawatomi | 99.0 /100 | #96 | Exceptional 91.3% |
| Pakistanis | 99.0 /100 | #97 | Exceptional 91.3% |
| Slavs | 98.7 /100 | #98 | Exceptional 91.2% |
| Immigrants | Bolivia | 98.6 /100 | #99 | Exceptional 91.2% |
| Immigrants | Central America | 98.4 /100 | #100 | Exceptional 91.1% |
| Bulgarians | 98.4 /100 | #101 | Exceptional 91.1% |
| Seminole | 98.3 /100 | #102 | Exceptional 91.1% |
| Yugoslavians | 98.3 /100 | #103 | Exceptional 91.1% |
| Asians | 98.2 /100 | #104 | Exceptional 91.1% |
| Laotians | 98.0 /100 | #105 | Exceptional 91.0% |
| Zimbabweans | 97.7 /100 | #106 | Exceptional 91.0% |
| Maltese | 97.7 /100 | #107 | Exceptional 91.0% |
| Hispanics or Latinos | 97.6 /100 | #108 | Exceptional 91.0% |
| Delaware | 97.6 /100 | #109 | Exceptional 91.0% |
| Mexican American Indians | 97.4 /100 | #110 | Exceptional 91.0% |