Macedonian vs Sierra Leonean 2 or more Vehicles in Household
COMPARE
Macedonian
Sierra Leonean
2 or more Vehicles in Household
2 or more Vehicles in Household Comparison
Macedonians
Sierra Leoneans
53.3%
2 OR MORE VEHICLES IN HOUSEHOLD
2.4/ 100
METRIC RATING
237th/ 347
METRIC RANK
52.9%
2 OR MORE VEHICLES IN HOUSEHOLD
1.2/ 100
METRIC RATING
247th/ 347
METRIC RANK
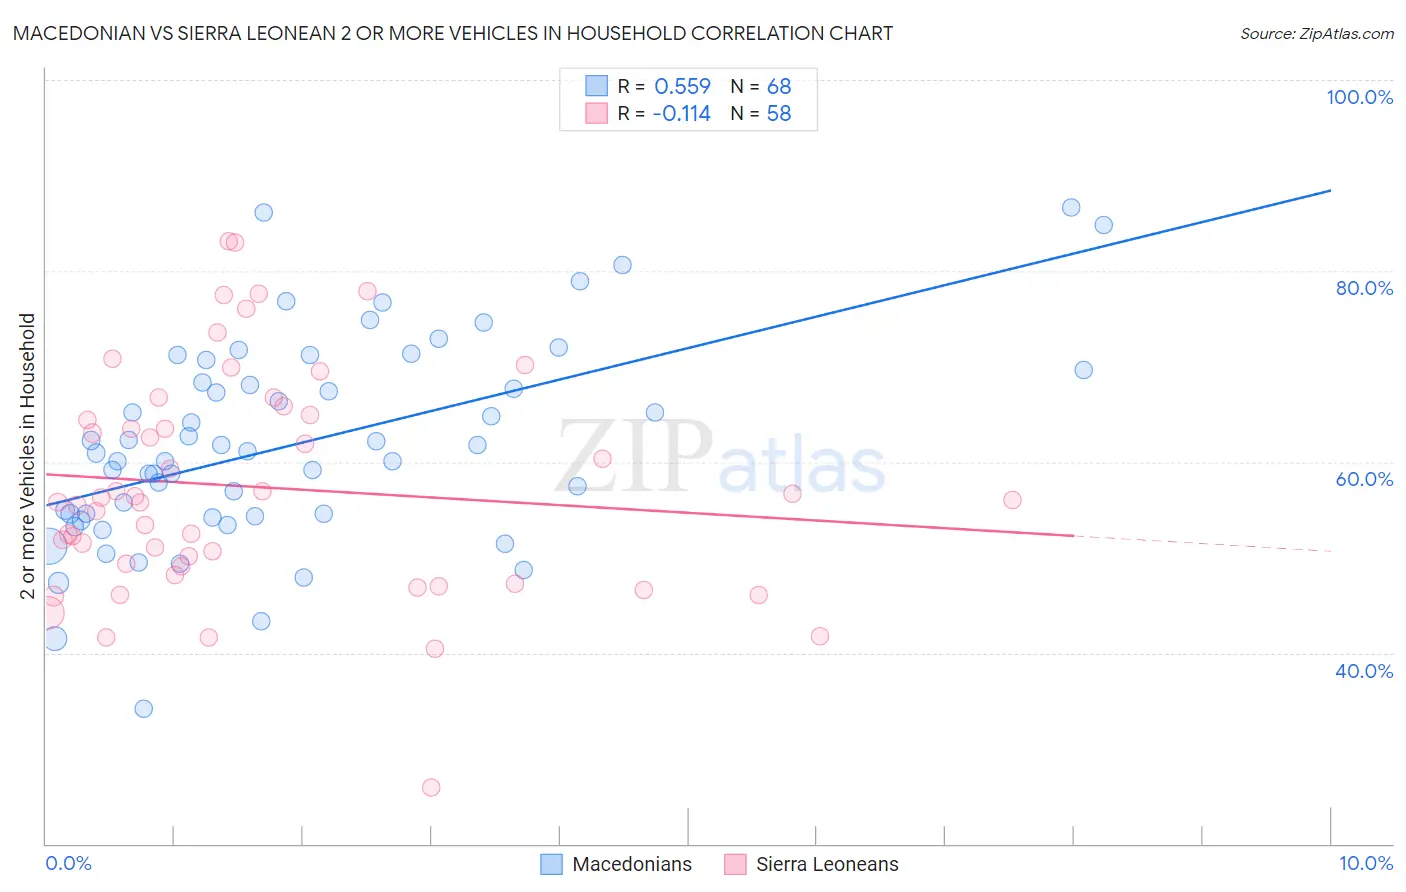
Macedonian vs Sierra Leonean 2 or more Vehicles in Household Correlation Chart
The statistical analysis conducted on geographies consisting of 132,543,746 people shows a substantial positive correlation between the proportion of Macedonians and percentage of households with 2 or more vehicles available in the United States with a correlation coefficient (R) of 0.559 and weighted average of 53.3%. Similarly, the statistical analysis conducted on geographies consisting of 83,352,562 people shows a poor negative correlation between the proportion of Sierra Leoneans and percentage of households with 2 or more vehicles available in the United States with a correlation coefficient (R) of -0.114 and weighted average of 52.9%, a difference of 0.75%.
2 or more Vehicles in Household Correlation Summary
| Measurement | Macedonian | Sierra Leonean |
| Minimum | 34.1% | 25.9% |
| Maximum | 86.7% | 83.1% |
| Range | 52.6% | 57.3% |
| Mean | 61.9% | 57.3% |
| Median | 61.0% | 55.9% |
| Interquartile 25% (IQ1) | 54.4% | 49.0% |
| Interquartile 75% (IQ3) | 69.0% | 64.9% |
| Interquartile Range (IQR) | 14.5% | 15.8% |
| Standard Deviation (Sample) | 10.7% | 11.8% |
| Standard Deviation (Population) | 10.6% | 11.7% |
Demographics Similar to Macedonians and Sierra Leoneans by 2 or more Vehicles in Household
In terms of 2 or more vehicles in household, the demographic groups most similar to Macedonians are Immigrants from Armenia (53.3%, a difference of 0.070%), Cambodian (53.3%, a difference of 0.070%), Indonesian (53.4%, a difference of 0.11%), Immigrants from Europe (53.2%, a difference of 0.14%), and Immigrants from Sierra Leone (53.2%, a difference of 0.17%). Similarly, the demographic groups most similar to Sierra Leoneans are Immigrants from Nigeria (52.9%, a difference of 0.030%), Colombian (52.9%, a difference of 0.12%), Immigrants from Brazil (52.8%, a difference of 0.18%), Mongolian (52.8%, a difference of 0.18%), and Immigrants from Sudan (52.8%, a difference of 0.21%).
| Demographics | Rating | Rank | 2 or more Vehicles in Household |
| Immigrants | Guatemala | 3.2 /100 | #232 | Tragic 53.5% |
| Ugandans | 3.2 /100 | #233 | Tragic 53.5% |
| Immigrants | Switzerland | 3.0 /100 | #234 | Tragic 53.4% |
| Immigrants | Middle Africa | 3.0 /100 | #235 | Tragic 53.4% |
| Indonesians | 2.7 /100 | #236 | Tragic 53.4% |
| Macedonians | 2.4 /100 | #237 | Tragic 53.3% |
| Immigrants | Armenia | 2.3 /100 | #238 | Tragic 53.3% |
| Cambodians | 2.3 /100 | #239 | Tragic 53.3% |
| Immigrants | Europe | 2.1 /100 | #240 | Tragic 53.2% |
| Immigrants | Sierra Leone | 2.1 /100 | #241 | Tragic 53.2% |
| Immigrants | Eastern Asia | 2.1 /100 | #242 | Tragic 53.2% |
| Ethiopians | 1.7 /100 | #243 | Tragic 53.1% |
| Indians (Asian) | 1.7 /100 | #244 | Tragic 53.1% |
| Immigrants | Ethiopia | 1.5 /100 | #245 | Tragic 53.0% |
| Immigrants | Nigeria | 1.2 /100 | #246 | Tragic 52.9% |
| Sierra Leoneans | 1.2 /100 | #247 | Tragic 52.9% |
| Colombians | 1.1 /100 | #248 | Tragic 52.9% |
| Immigrants | Brazil | 1.0 /100 | #249 | Tragic 52.8% |
| Mongolians | 1.0 /100 | #250 | Tragic 52.8% |
| Immigrants | Sudan | 1.0 /100 | #251 | Tragic 52.8% |
| Immigrants | Portugal | 1.0 /100 | #252 | Tragic 52.8% |