Immigrants from Grenada vs Sierra Leonean 2 or more Vehicles in Household
COMPARE
Immigrants from Grenada
Sierra Leonean
2 or more Vehicles in Household
2 or more Vehicles in Household Comparison
Immigrants from Grenada
Sierra Leoneans
28.7%
2 OR MORE VEHICLES IN HOUSEHOLD
0.0/ 100
METRIC RATING
347th/ 347
METRIC RANK
52.9%
2 OR MORE VEHICLES IN HOUSEHOLD
1.2/ 100
METRIC RATING
247th/ 347
METRIC RANK
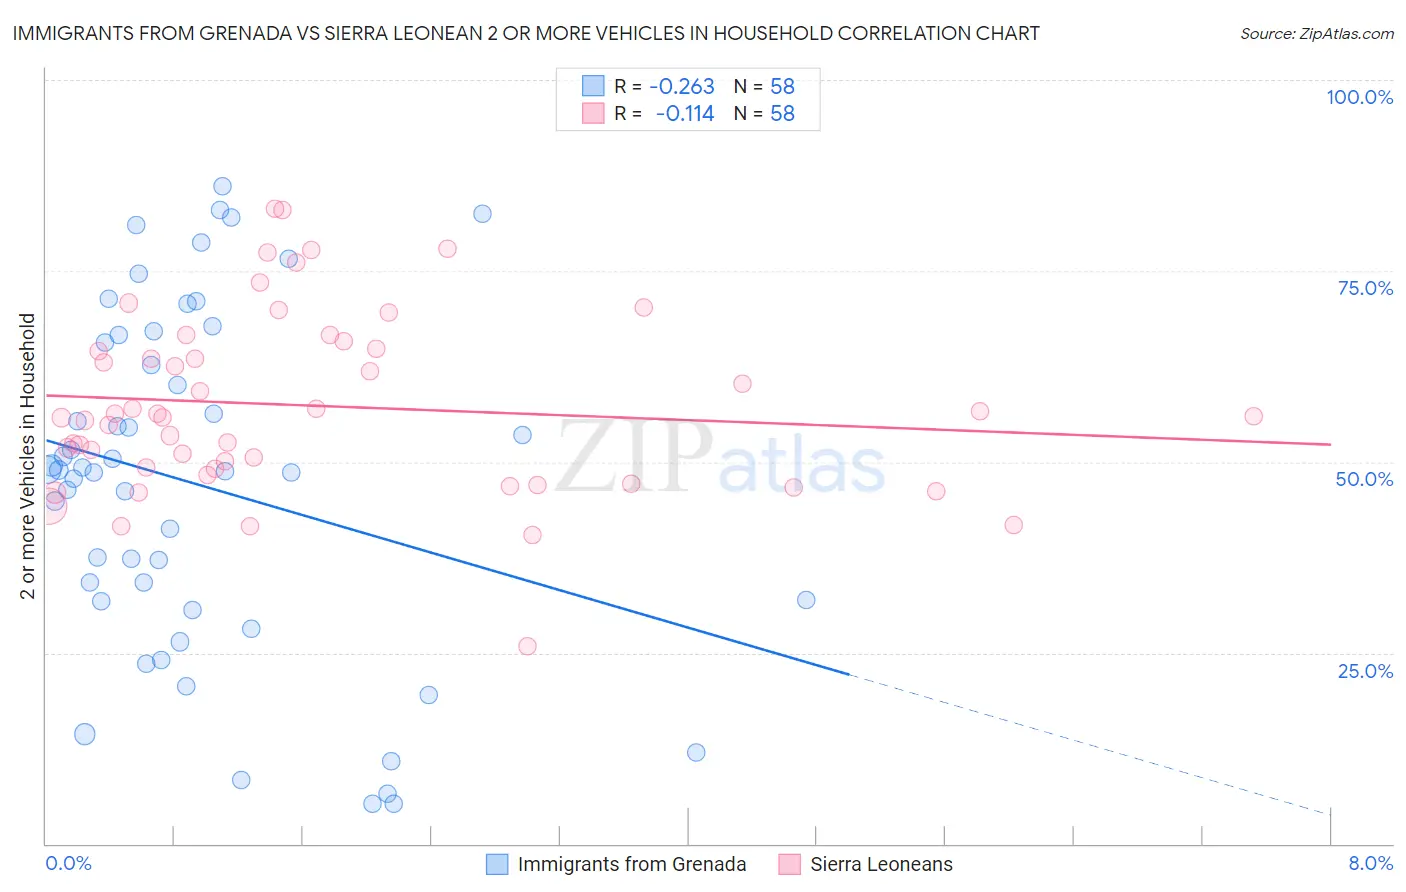
Immigrants from Grenada vs Sierra Leonean 2 or more Vehicles in Household Correlation Chart
The statistical analysis conducted on geographies consisting of 67,200,374 people shows a weak negative correlation between the proportion of Immigrants from Grenada and percentage of households with 2 or more vehicles available in the United States with a correlation coefficient (R) of -0.263 and weighted average of 28.7%. Similarly, the statistical analysis conducted on geographies consisting of 83,352,562 people shows a poor negative correlation between the proportion of Sierra Leoneans and percentage of households with 2 or more vehicles available in the United States with a correlation coefficient (R) of -0.114 and weighted average of 52.9%, a difference of 84.6%.
2 or more Vehicles in Household Correlation Summary
| Measurement | Immigrants from Grenada | Sierra Leonean |
| Minimum | 5.2% | 25.9% |
| Maximum | 86.2% | 83.1% |
| Range | 81.0% | 57.3% |
| Mean | 46.9% | 57.3% |
| Median | 48.8% | 55.9% |
| Interquartile 25% (IQ1) | 31.8% | 49.0% |
| Interquartile 75% (IQ3) | 65.6% | 64.9% |
| Interquartile Range (IQR) | 33.8% | 15.8% |
| Standard Deviation (Sample) | 22.2% | 11.8% |
| Standard Deviation (Population) | 22.0% | 11.7% |
Similar Demographics by 2 or more Vehicles in Household
Demographics Similar to Immigrants from Grenada by 2 or more Vehicles in Household
In terms of 2 or more vehicles in household, the demographic groups most similar to Immigrants from Grenada are Immigrants from St. Vincent and the Grenadines (31.0%, a difference of 8.1%), Immigrants from Dominican Republic (33.2%, a difference of 16.0%), Yup'ik (34.9%, a difference of 21.9%), Immigrants from Guyana (35.0%, a difference of 22.1%), and Dominican (35.3%, a difference of 23.2%).
| Demographics | Rating | Rank | 2 or more Vehicles in Household |
| Immigrants | Ecuador | 0.0 /100 | #333 | Tragic 40.5% |
| Immigrants | Trinidad and Tobago | 0.0 /100 | #334 | Tragic 40.3% |
| Immigrants | Bangladesh | 0.0 /100 | #335 | Tragic 38.8% |
| Vietnamese | 0.0 /100 | #336 | Tragic 38.5% |
| Barbadians | 0.0 /100 | #337 | Tragic 38.3% |
| Immigrants | Uzbekistan | 0.0 /100 | #338 | Tragic 37.9% |
| Immigrants | Barbados | 0.0 /100 | #339 | Tragic 35.8% |
| British West Indians | 0.0 /100 | #340 | Tragic 35.4% |
| Guyanese | 0.0 /100 | #341 | Tragic 35.4% |
| Dominicans | 0.0 /100 | #342 | Tragic 35.3% |
| Immigrants | Guyana | 0.0 /100 | #343 | Tragic 35.0% |
| Yup'ik | 0.0 /100 | #344 | Tragic 34.9% |
| Immigrants | Dominican Republic | 0.0 /100 | #345 | Tragic 33.2% |
| Immigrants | St. Vincent and the Grenadines | 0.0 /100 | #346 | Tragic 31.0% |
| Immigrants | Grenada | 0.0 /100 | #347 | Tragic 28.7% |
Demographics Similar to Sierra Leoneans by 2 or more Vehicles in Household
In terms of 2 or more vehicles in household, the demographic groups most similar to Sierra Leoneans are Immigrants from Nigeria (52.9%, a difference of 0.030%), Colombian (52.9%, a difference of 0.12%), Immigrants from Brazil (52.8%, a difference of 0.18%), Mongolian (52.8%, a difference of 0.18%), and Immigrants from Sudan (52.8%, a difference of 0.21%).
| Demographics | Rating | Rank | 2 or more Vehicles in Household |
| Immigrants | Europe | 2.1 /100 | #240 | Tragic 53.2% |
| Immigrants | Sierra Leone | 2.1 /100 | #241 | Tragic 53.2% |
| Immigrants | Eastern Asia | 2.1 /100 | #242 | Tragic 53.2% |
| Ethiopians | 1.7 /100 | #243 | Tragic 53.1% |
| Indians (Asian) | 1.7 /100 | #244 | Tragic 53.1% |
| Immigrants | Ethiopia | 1.5 /100 | #245 | Tragic 53.0% |
| Immigrants | Nigeria | 1.2 /100 | #246 | Tragic 52.9% |
| Sierra Leoneans | 1.2 /100 | #247 | Tragic 52.9% |
| Colombians | 1.1 /100 | #248 | Tragic 52.9% |
| Immigrants | Brazil | 1.0 /100 | #249 | Tragic 52.8% |
| Mongolians | 1.0 /100 | #250 | Tragic 52.8% |
| Immigrants | Sudan | 1.0 /100 | #251 | Tragic 52.8% |
| Immigrants | Portugal | 1.0 /100 | #252 | Tragic 52.8% |
| Nigerians | 0.9 /100 | #253 | Tragic 52.8% |
| Immigrants | Malaysia | 0.8 /100 | #254 | Tragic 52.7% |