Immigrants from Indonesia vs Immigrants from Bulgaria 4 or more Vehicles in Household
COMPARE
Immigrants from Indonesia
Immigrants from Bulgaria
4 or more Vehicles in Household
4 or more Vehicles in Household Comparison
Immigrants from Indonesia
Immigrants from Bulgaria
7.2%
4 OR MORE VEHICLES IN HOUSEHOLD
99.6/ 100
METRIC RATING
86th/ 347
METRIC RANK
5.5%
4 OR MORE VEHICLES IN HOUSEHOLD
0.5/ 100
METRIC RATING
277th/ 347
METRIC RANK
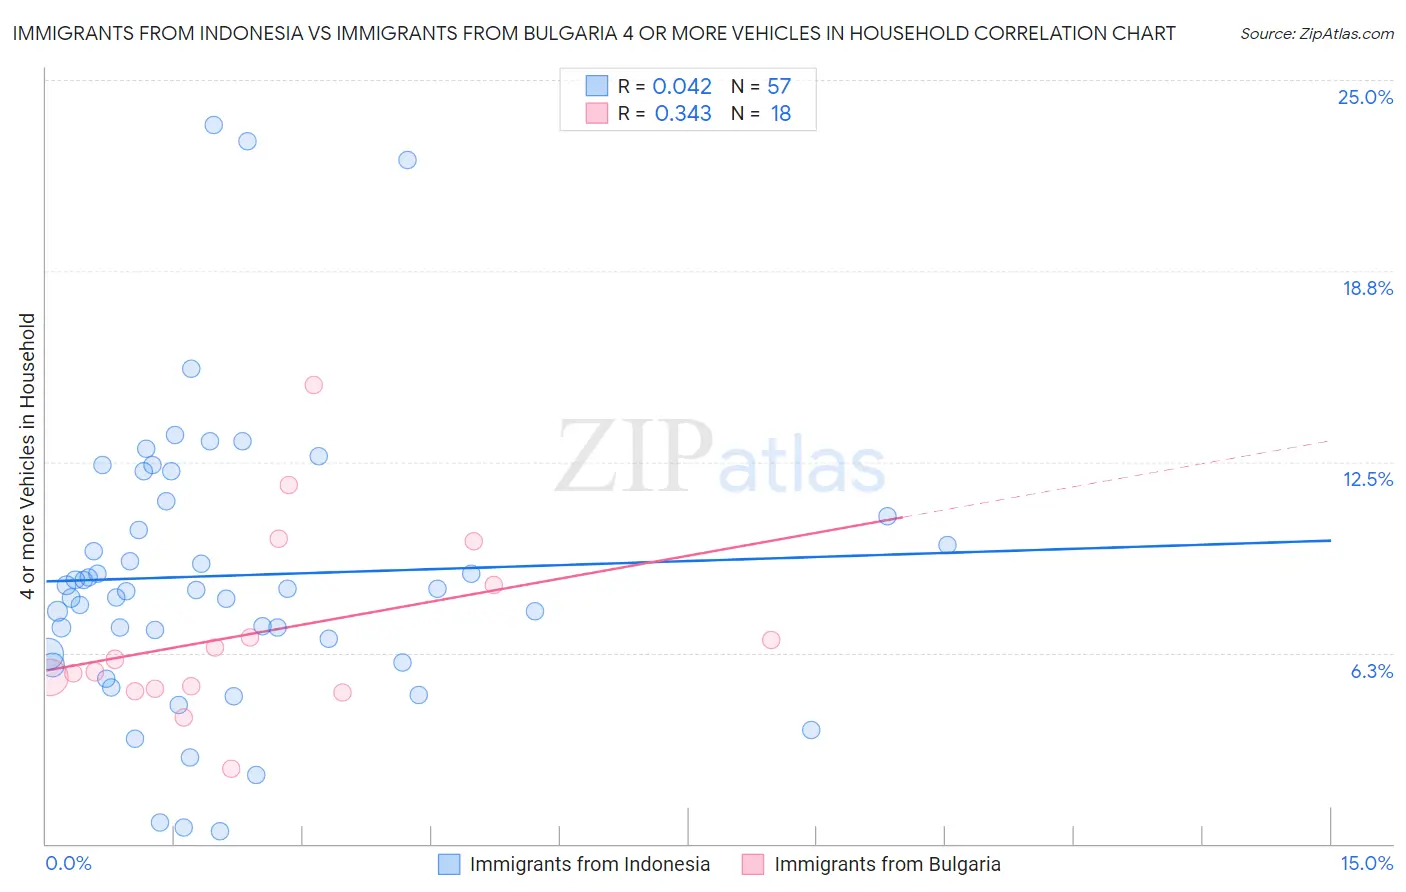
Immigrants from Indonesia vs Immigrants from Bulgaria 4 or more Vehicles in Household Correlation Chart
The statistical analysis conducted on geographies consisting of 214,959,702 people shows no correlation between the proportion of Immigrants from Indonesia and percentage of households with 4 or more vehicles available in the United States with a correlation coefficient (R) of 0.042 and weighted average of 7.2%. Similarly, the statistical analysis conducted on geographies consisting of 172,084,774 people shows a mild positive correlation between the proportion of Immigrants from Bulgaria and percentage of households with 4 or more vehicles available in the United States with a correlation coefficient (R) of 0.343 and weighted average of 5.5%, a difference of 31.9%.
4 or more Vehicles in Household Correlation Summary
| Measurement | Immigrants from Indonesia | Immigrants from Bulgaria |
| Minimum | 0.42% | 2.5% |
| Maximum | 23.5% | 15.0% |
| Range | 23.1% | 12.5% |
| Mean | 8.8% | 6.9% |
| Median | 8.3% | 5.8% |
| Interquartile 25% (IQ1) | 6.1% | 5.1% |
| Interquartile 75% (IQ3) | 11.0% | 8.4% |
| Interquartile Range (IQR) | 4.9% | 3.4% |
| Standard Deviation (Sample) | 4.8% | 3.0% |
| Standard Deviation (Population) | 4.7% | 3.0% |
Similar Demographics by 4 or more Vehicles in Household
Demographics Similar to Immigrants from Indonesia by 4 or more Vehicles in Household
In terms of 4 or more vehicles in household, the demographic groups most similar to Immigrants from Indonesia are Delaware (7.2%, a difference of 0.060%), Nonimmigrants (7.2%, a difference of 0.080%), Cree (7.2%, a difference of 0.18%), Afghan (7.3%, a difference of 0.35%), and British (7.2%, a difference of 0.41%).
| Demographics | Rating | Rank | 4 or more Vehicles in Household |
| Czechs | 99.8 /100 | #79 | Exceptional 7.4% |
| Alaska Natives | 99.8 /100 | #80 | Exceptional 7.3% |
| Finns | 99.8 /100 | #81 | Exceptional 7.3% |
| Northern Europeans | 99.8 /100 | #82 | Exceptional 7.3% |
| Potawatomi | 99.7 /100 | #83 | Exceptional 7.3% |
| Afghans | 99.7 /100 | #84 | Exceptional 7.3% |
| Cree | 99.7 /100 | #85 | Exceptional 7.2% |
| Immigrants | Indonesia | 99.6 /100 | #86 | Exceptional 7.2% |
| Delaware | 99.6 /100 | #87 | Exceptional 7.2% |
| Immigrants | Nonimmigrants | 99.6 /100 | #88 | Exceptional 7.2% |
| British | 99.6 /100 | #89 | Exceptional 7.2% |
| Creek | 99.6 /100 | #90 | Exceptional 7.2% |
| Assyrians/Chaldeans/Syriacs | 99.4 /100 | #91 | Exceptional 7.2% |
| Immigrants | Latin America | 99.4 /100 | #92 | Exceptional 7.1% |
| Immigrants | Afghanistan | 99.3 /100 | #93 | Exceptional 7.1% |
Demographics Similar to Immigrants from Bulgaria by 4 or more Vehicles in Household
In terms of 4 or more vehicles in household, the demographic groups most similar to Immigrants from Bulgaria are Immigrants from Latvia (5.5%, a difference of 0.12%), Cambodian (5.5%, a difference of 0.13%), Black/African American (5.5%, a difference of 0.25%), Macedonian (5.5%, a difference of 0.37%), and Immigrants from Kazakhstan (5.5%, a difference of 0.40%).
| Demographics | Rating | Rank | 4 or more Vehicles in Household |
| Okinawans | 0.6 /100 | #270 | Tragic 5.5% |
| Immigrants | Sudan | 0.6 /100 | #271 | Tragic 5.5% |
| Immigrants | Kazakhstan | 0.6 /100 | #272 | Tragic 5.5% |
| Macedonians | 0.6 /100 | #273 | Tragic 5.5% |
| Blacks/African Americans | 0.6 /100 | #274 | Tragic 5.5% |
| Cambodians | 0.5 /100 | #275 | Tragic 5.5% |
| Immigrants | Latvia | 0.5 /100 | #276 | Tragic 5.5% |
| Immigrants | Bulgaria | 0.5 /100 | #277 | Tragic 5.5% |
| Immigrants | Eastern Europe | 0.4 /100 | #278 | Tragic 5.4% |
| Immigrants | Uruguay | 0.3 /100 | #279 | Tragic 5.4% |
| Alsatians | 0.3 /100 | #280 | Tragic 5.4% |
| Immigrants | Western Africa | 0.3 /100 | #281 | Tragic 5.4% |
| Immigrants | Spain | 0.3 /100 | #282 | Tragic 5.4% |
| Immigrants | Ireland | 0.3 /100 | #283 | Tragic 5.4% |
| Brazilians | 0.3 /100 | #284 | Tragic 5.4% |