Immigrants from Indonesia vs Samoan 4 or more Vehicles in Household
COMPARE
Immigrants from Indonesia
Samoan
4 or more Vehicles in Household
4 or more Vehicles in Household Comparison
Immigrants from Indonesia
Samoans
7.2%
4 OR MORE VEHICLES IN HOUSEHOLD
99.6/ 100
METRIC RATING
86th/ 347
METRIC RANK
9.2%
4 OR MORE VEHICLES IN HOUSEHOLD
100.0/ 100
METRIC RATING
9th/ 347
METRIC RANK
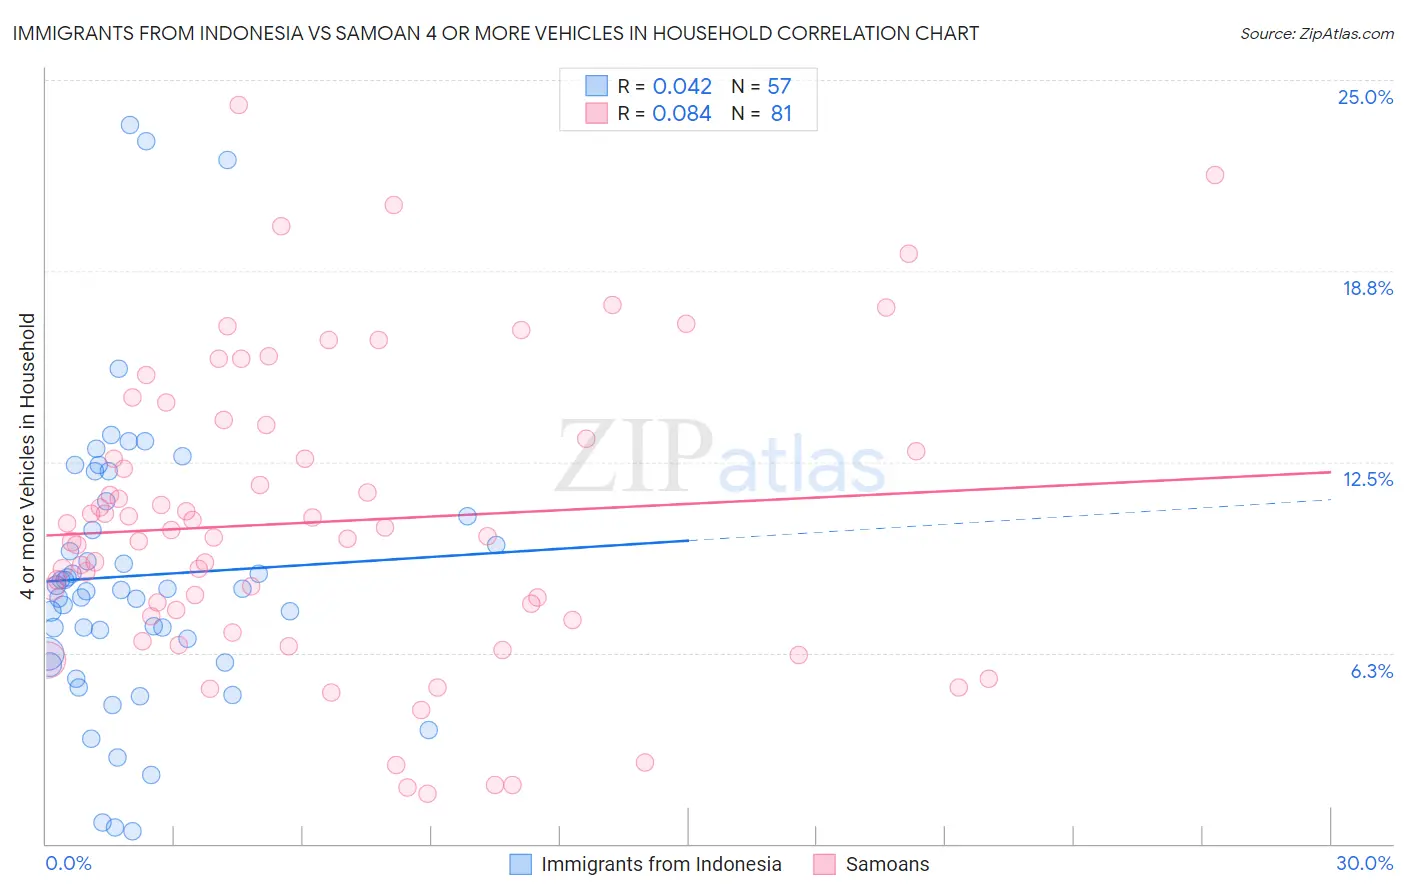
Immigrants from Indonesia vs Samoan 4 or more Vehicles in Household Correlation Chart
The statistical analysis conducted on geographies consisting of 214,959,702 people shows no correlation between the proportion of Immigrants from Indonesia and percentage of households with 4 or more vehicles available in the United States with a correlation coefficient (R) of 0.042 and weighted average of 7.2%. Similarly, the statistical analysis conducted on geographies consisting of 224,510,493 people shows a slight positive correlation between the proportion of Samoans and percentage of households with 4 or more vehicles available in the United States with a correlation coefficient (R) of 0.084 and weighted average of 9.2%, a difference of 27.6%.
4 or more Vehicles in Household Correlation Summary
| Measurement | Immigrants from Indonesia | Samoan |
| Minimum | 0.42% | 1.7% |
| Maximum | 23.5% | 24.2% |
| Range | 23.1% | 22.5% |
| Mean | 8.8% | 10.5% |
| Median | 8.3% | 10.1% |
| Interquartile 25% (IQ1) | 6.1% | 7.4% |
| Interquartile 75% (IQ3) | 11.0% | 13.5% |
| Interquartile Range (IQR) | 4.9% | 6.1% |
| Standard Deviation (Sample) | 4.8% | 4.9% |
| Standard Deviation (Population) | 4.7% | 4.8% |
Similar Demographics by 4 or more Vehicles in Household
Demographics Similar to Immigrants from Indonesia by 4 or more Vehicles in Household
In terms of 4 or more vehicles in household, the demographic groups most similar to Immigrants from Indonesia are Delaware (7.2%, a difference of 0.060%), Nonimmigrants (7.2%, a difference of 0.080%), Cree (7.2%, a difference of 0.18%), Afghan (7.3%, a difference of 0.35%), and British (7.2%, a difference of 0.41%).
| Demographics | Rating | Rank | 4 or more Vehicles in Household |
| Czechs | 99.8 /100 | #79 | Exceptional 7.4% |
| Alaska Natives | 99.8 /100 | #80 | Exceptional 7.3% |
| Finns | 99.8 /100 | #81 | Exceptional 7.3% |
| Northern Europeans | 99.8 /100 | #82 | Exceptional 7.3% |
| Potawatomi | 99.7 /100 | #83 | Exceptional 7.3% |
| Afghans | 99.7 /100 | #84 | Exceptional 7.3% |
| Cree | 99.7 /100 | #85 | Exceptional 7.2% |
| Immigrants | Indonesia | 99.6 /100 | #86 | Exceptional 7.2% |
| Delaware | 99.6 /100 | #87 | Exceptional 7.2% |
| Immigrants | Nonimmigrants | 99.6 /100 | #88 | Exceptional 7.2% |
| British | 99.6 /100 | #89 | Exceptional 7.2% |
| Creek | 99.6 /100 | #90 | Exceptional 7.2% |
| Assyrians/Chaldeans/Syriacs | 99.4 /100 | #91 | Exceptional 7.2% |
| Immigrants | Latin America | 99.4 /100 | #92 | Exceptional 7.1% |
| Immigrants | Afghanistan | 99.3 /100 | #93 | Exceptional 7.1% |
Demographics Similar to Samoans by 4 or more Vehicles in Household
In terms of 4 or more vehicles in household, the demographic groups most similar to Samoans are Arapaho (9.4%, a difference of 1.4%), Native Hawaiian (9.4%, a difference of 1.8%), Puget Sound Salish (9.4%, a difference of 1.8%), Paiute (9.0%, a difference of 2.4%), and Immigrants from Mexico (9.0%, a difference of 2.5%).
| Demographics | Rating | Rank | 4 or more Vehicles in Household |
| Colville | 100.0 /100 | #2 | Exceptional 11.1% |
| Spanish American Indians | 100.0 /100 | #3 | Exceptional 10.8% |
| Tongans | 100.0 /100 | #4 | Exceptional 10.0% |
| Immigrants | Fiji | 100.0 /100 | #5 | Exceptional 9.6% |
| Puget Sound Salish | 100.0 /100 | #6 | Exceptional 9.4% |
| Native Hawaiians | 100.0 /100 | #7 | Exceptional 9.4% |
| Arapaho | 100.0 /100 | #8 | Exceptional 9.4% |
| Samoans | 100.0 /100 | #9 | Exceptional 9.2% |
| Paiute | 100.0 /100 | #10 | Exceptional 9.0% |
| Immigrants | Mexico | 100.0 /100 | #11 | Exceptional 9.0% |
| Mexicans | 100.0 /100 | #12 | Exceptional 8.9% |
| Hawaiians | 100.0 /100 | #13 | Exceptional 8.9% |
| Chinese | 100.0 /100 | #14 | Exceptional 8.8% |
| Shoshone | 100.0 /100 | #15 | Exceptional 8.8% |
| Lumbee | 100.0 /100 | #16 | Exceptional 8.8% |