Immigrants from Indonesia vs Immigrants from Bulgaria In Labor Force | Age 16-19
COMPARE
Immigrants from Indonesia
Immigrants from Bulgaria
In Labor Force | Age 16-19
In Labor Force | Age 16-19 Comparison
Immigrants from Indonesia
Immigrants from Bulgaria
33.5%
IN LABOR FORCE | AGE 16-19
0.1/ 100
METRIC RATING
288th/ 347
METRIC RANK
37.3%
IN LABOR FORCE | AGE 16-19
81.6/ 100
METRIC RATING
154th/ 347
METRIC RANK
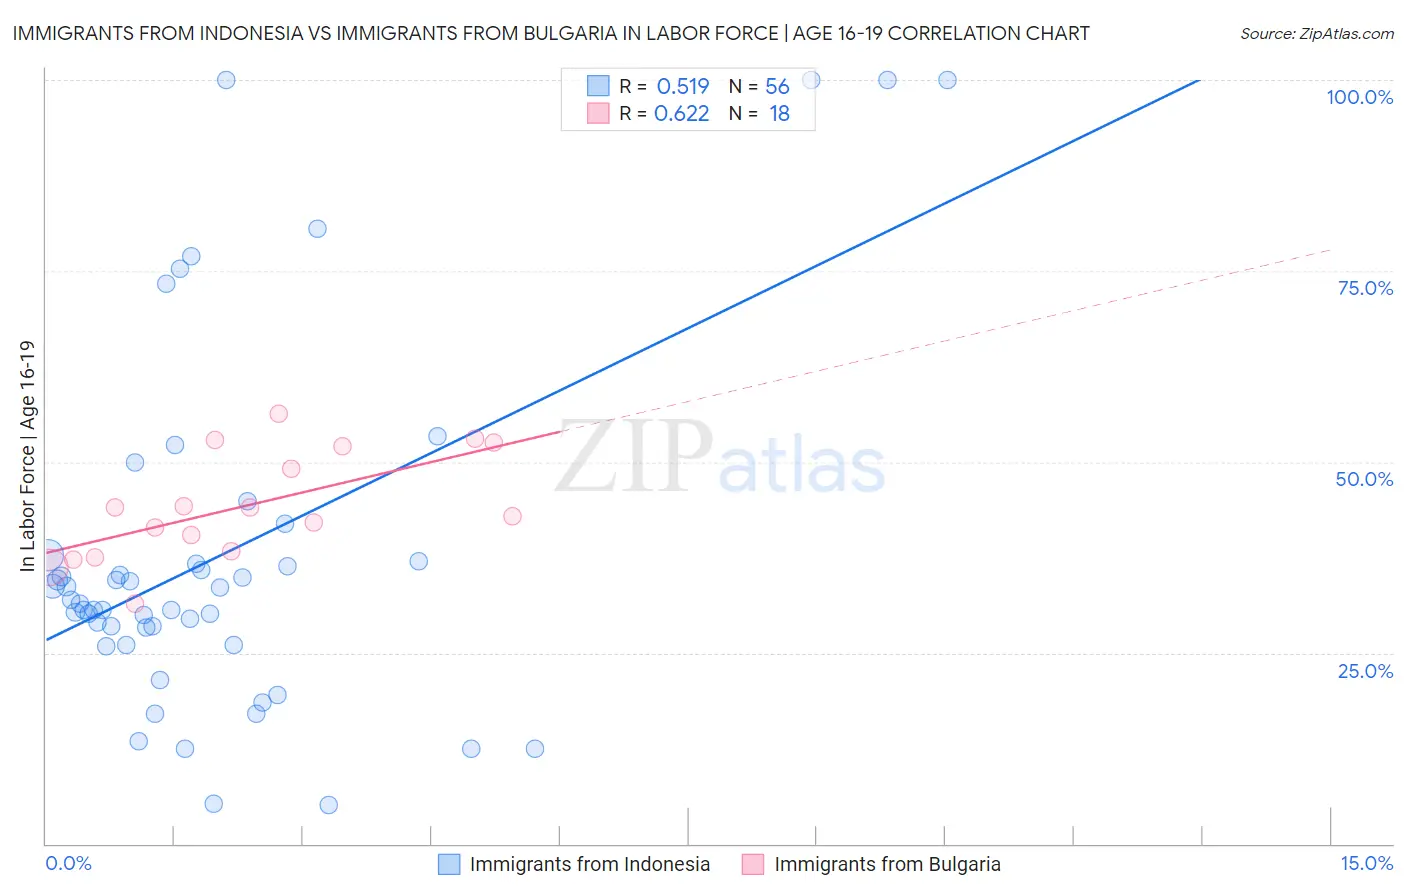
Immigrants from Indonesia vs Immigrants from Bulgaria In Labor Force | Age 16-19 Correlation Chart
The statistical analysis conducted on geographies consisting of 215,635,356 people shows a substantial positive correlation between the proportion of Immigrants from Indonesia and labor force participation rate among population between the ages 16 and 19 in the United States with a correlation coefficient (R) of 0.519 and weighted average of 33.5%. Similarly, the statistical analysis conducted on geographies consisting of 172,373,837 people shows a significant positive correlation between the proportion of Immigrants from Bulgaria and labor force participation rate among population between the ages 16 and 19 in the United States with a correlation coefficient (R) of 0.622 and weighted average of 37.3%, a difference of 11.2%.
In Labor Force | Age 16-19 Correlation Summary
| Measurement | Immigrants from Indonesia | Immigrants from Bulgaria |
| Minimum | 5.1% | 31.4% |
| Maximum | 100.0% | 56.3% |
| Range | 94.9% | 24.8% |
| Mean | 37.9% | 44.2% |
| Median | 31.7% | 43.5% |
| Interquartile 25% (IQ1) | 27.2% | 38.4% |
| Interquartile 75% (IQ3) | 37.4% | 52.0% |
| Interquartile Range (IQR) | 10.2% | 13.6% |
| Standard Deviation (Sample) | 23.4% | 7.0% |
| Standard Deviation (Population) | 23.2% | 6.8% |
Similar Demographics by In Labor Force | Age 16-19
Demographics Similar to Immigrants from Indonesia by In Labor Force | Age 16-19
In terms of in labor force | age 16-19, the demographic groups most similar to Immigrants from Indonesia are Immigrants from Singapore (33.5%, a difference of 0.0%), Nepalese (33.5%, a difference of 0.040%), Immigrants from Colombia (33.5%, a difference of 0.14%), Immigrants from Belarus (33.4%, a difference of 0.22%), and South American (33.6%, a difference of 0.27%).
| Demographics | Rating | Rank | In Labor Force | Age 16-19 |
| Cypriots | 0.3 /100 | #281 | Tragic 33.8% |
| Immigrants | Korea | 0.3 /100 | #282 | Tragic 33.8% |
| Immigrants | Venezuela | 0.2 /100 | #283 | Tragic 33.7% |
| Immigrants | Spain | 0.2 /100 | #284 | Tragic 33.7% |
| U.S. Virgin Islanders | 0.2 /100 | #285 | Tragic 33.6% |
| South Americans | 0.2 /100 | #286 | Tragic 33.6% |
| Nepalese | 0.1 /100 | #287 | Tragic 33.5% |
| Immigrants | Indonesia | 0.1 /100 | #288 | Tragic 33.5% |
| Immigrants | Singapore | 0.1 /100 | #289 | Tragic 33.5% |
| Immigrants | Colombia | 0.1 /100 | #290 | Tragic 33.5% |
| Immigrants | Belarus | 0.1 /100 | #291 | Tragic 33.4% |
| Haitians | 0.1 /100 | #292 | Tragic 33.4% |
| Immigrants | South America | 0.1 /100 | #293 | Tragic 33.3% |
| Argentineans | 0.1 /100 | #294 | Tragic 33.3% |
| Yup'ik | 0.1 /100 | #295 | Tragic 33.3% |
Demographics Similar to Immigrants from Bulgaria by In Labor Force | Age 16-19
In terms of in labor force | age 16-19, the demographic groups most similar to Immigrants from Bulgaria are Arapaho (37.3%, a difference of 0.020%), Immigrants from Lithuania (37.2%, a difference of 0.070%), Kiowa (37.2%, a difference of 0.10%), Immigrants from Sierra Leone (37.3%, a difference of 0.17%), and Immigrants from Poland (37.3%, a difference of 0.25%).
| Demographics | Rating | Rank | In Labor Force | Age 16-19 |
| Brazilians | 88.7 /100 | #147 | Excellent 37.5% |
| Romanians | 87.3 /100 | #148 | Excellent 37.5% |
| Native Hawaiians | 85.0 /100 | #149 | Excellent 37.4% |
| Tsimshian | 84.7 /100 | #150 | Excellent 37.4% |
| Immigrants | Poland | 84.4 /100 | #151 | Excellent 37.3% |
| Immigrants | Sierra Leone | 83.6 /100 | #152 | Excellent 37.3% |
| Arapaho | 81.8 /100 | #153 | Excellent 37.3% |
| Immigrants | Bulgaria | 81.6 /100 | #154 | Excellent 37.3% |
| Immigrants | Lithuania | 80.7 /100 | #155 | Excellent 37.2% |
| Kiowa | 80.4 /100 | #156 | Excellent 37.2% |
| Immigrants | Brazil | 76.5 /100 | #157 | Good 37.1% |
| Ute | 75.7 /100 | #158 | Good 37.1% |
| Yaqui | 74.4 /100 | #159 | Good 37.1% |
| Immigrants | Saudi Arabia | 73.9 /100 | #160 | Good 37.0% |
| Cambodians | 71.5 /100 | #161 | Good 37.0% |