Immigrants from Indonesia vs Yuman 4 or more Vehicles in Household
COMPARE
Immigrants from Indonesia
Yuman
4 or more Vehicles in Household
4 or more Vehicles in Household Comparison
Immigrants from Indonesia
Yuman
7.2%
4 OR MORE VEHICLES IN HOUSEHOLD
99.6/ 100
METRIC RATING
86th/ 347
METRIC RANK
6.5%
4 OR MORE VEHICLES IN HOUSEHOLD
72.1/ 100
METRIC RATING
152nd/ 347
METRIC RANK
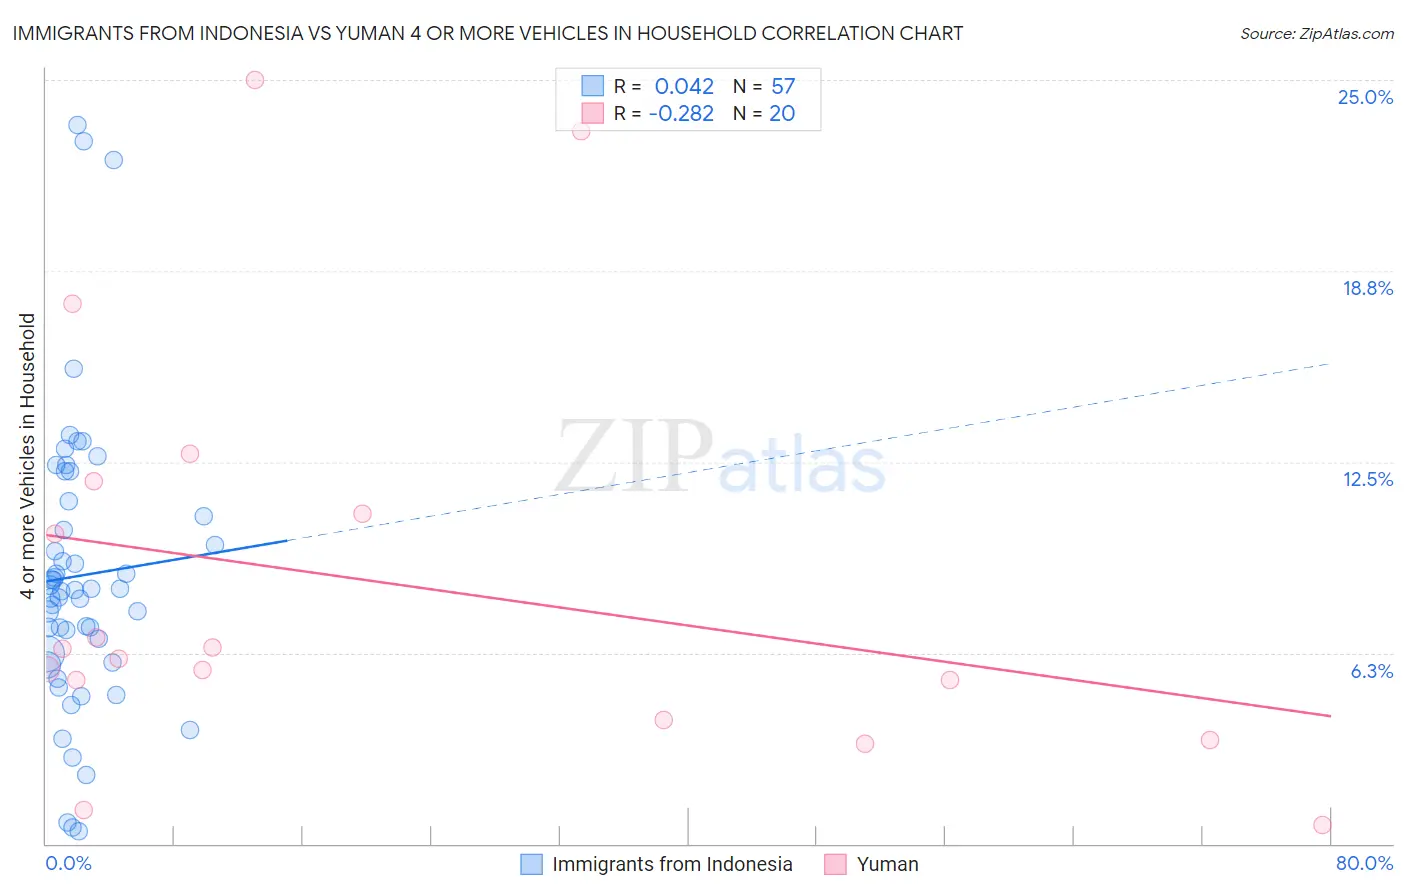
Immigrants from Indonesia vs Yuman 4 or more Vehicles in Household Correlation Chart
The statistical analysis conducted on geographies consisting of 214,959,702 people shows no correlation between the proportion of Immigrants from Indonesia and percentage of households with 4 or more vehicles available in the United States with a correlation coefficient (R) of 0.042 and weighted average of 7.2%. Similarly, the statistical analysis conducted on geographies consisting of 40,628,195 people shows a weak negative correlation between the proportion of Yuman and percentage of households with 4 or more vehicles available in the United States with a correlation coefficient (R) of -0.282 and weighted average of 6.5%, a difference of 11.6%.
4 or more Vehicles in Household Correlation Summary
| Measurement | Immigrants from Indonesia | Yuman |
| Minimum | 0.42% | 0.62% |
| Maximum | 23.5% | 25.0% |
| Range | 23.1% | 24.4% |
| Mean | 8.8% | 8.6% |
| Median | 8.3% | 6.2% |
| Interquartile 25% (IQ1) | 6.1% | 4.7% |
| Interquartile 75% (IQ3) | 11.0% | 11.3% |
| Interquartile Range (IQR) | 4.9% | 6.6% |
| Standard Deviation (Sample) | 4.8% | 6.7% |
| Standard Deviation (Population) | 4.7% | 6.5% |
Similar Demographics by 4 or more Vehicles in Household
Demographics Similar to Immigrants from Indonesia by 4 or more Vehicles in Household
In terms of 4 or more vehicles in household, the demographic groups most similar to Immigrants from Indonesia are Delaware (7.2%, a difference of 0.060%), Nonimmigrants (7.2%, a difference of 0.080%), Cree (7.2%, a difference of 0.18%), Afghan (7.3%, a difference of 0.35%), and British (7.2%, a difference of 0.41%).
| Demographics | Rating | Rank | 4 or more Vehicles in Household |
| Czechs | 99.8 /100 | #79 | Exceptional 7.4% |
| Alaska Natives | 99.8 /100 | #80 | Exceptional 7.3% |
| Finns | 99.8 /100 | #81 | Exceptional 7.3% |
| Northern Europeans | 99.8 /100 | #82 | Exceptional 7.3% |
| Potawatomi | 99.7 /100 | #83 | Exceptional 7.3% |
| Afghans | 99.7 /100 | #84 | Exceptional 7.3% |
| Cree | 99.7 /100 | #85 | Exceptional 7.2% |
| Immigrants | Indonesia | 99.6 /100 | #86 | Exceptional 7.2% |
| Delaware | 99.6 /100 | #87 | Exceptional 7.2% |
| Immigrants | Nonimmigrants | 99.6 /100 | #88 | Exceptional 7.2% |
| British | 99.6 /100 | #89 | Exceptional 7.2% |
| Creek | 99.6 /100 | #90 | Exceptional 7.2% |
| Assyrians/Chaldeans/Syriacs | 99.4 /100 | #91 | Exceptional 7.2% |
| Immigrants | Latin America | 99.4 /100 | #92 | Exceptional 7.1% |
| Immigrants | Afghanistan | 99.3 /100 | #93 | Exceptional 7.1% |
Demographics Similar to Yuman by 4 or more Vehicles in Household
In terms of 4 or more vehicles in household, the demographic groups most similar to Yuman are Immigrants from Hong Kong (6.5%, a difference of 0.010%), Immigrants from Armenia (6.5%, a difference of 0.11%), Central American Indian (6.5%, a difference of 0.13%), New Zealander (6.5%, a difference of 0.15%), and Immigrants from Jordan (6.5%, a difference of 0.19%).
| Demographics | Rating | Rank | 4 or more Vehicles in Household |
| Croatians | 77.8 /100 | #145 | Good 6.5% |
| Immigrants | Costa Rica | 74.4 /100 | #146 | Good 6.5% |
| Immigrants | Iran | 73.9 /100 | #147 | Good 6.5% |
| Immigrants | Jordan | 73.7 /100 | #148 | Good 6.5% |
| Greeks | 73.6 /100 | #149 | Good 6.5% |
| New Zealanders | 73.3 /100 | #150 | Good 6.5% |
| Immigrants | Hong Kong | 72.2 /100 | #151 | Good 6.5% |
| Yuman | 72.1 /100 | #152 | Good 6.5% |
| Immigrants | Armenia | 71.2 /100 | #153 | Good 6.5% |
| Central American Indians | 71.1 /100 | #154 | Good 6.5% |
| Iroquois | 70.4 /100 | #155 | Good 6.5% |
| Iranians | 69.9 /100 | #156 | Good 6.5% |
| Peruvians | 69.4 /100 | #157 | Good 6.5% |
| Zimbabweans | 67.1 /100 | #158 | Good 6.4% |
| Indians (Asian) | 66.3 /100 | #159 | Good 6.4% |