Immigrants from Honduras vs Immigrants from Bulgaria 4 or more Vehicles in Household
COMPARE
Immigrants from Honduras
Immigrants from Bulgaria
4 or more Vehicles in Household
4 or more Vehicles in Household Comparison
Immigrants from Honduras
Immigrants from Bulgaria
6.1%
4 OR MORE VEHICLES IN HOUSEHOLD
15.4/ 100
METRIC RATING
209th/ 347
METRIC RANK
5.5%
4 OR MORE VEHICLES IN HOUSEHOLD
0.5/ 100
METRIC RATING
277th/ 347
METRIC RANK
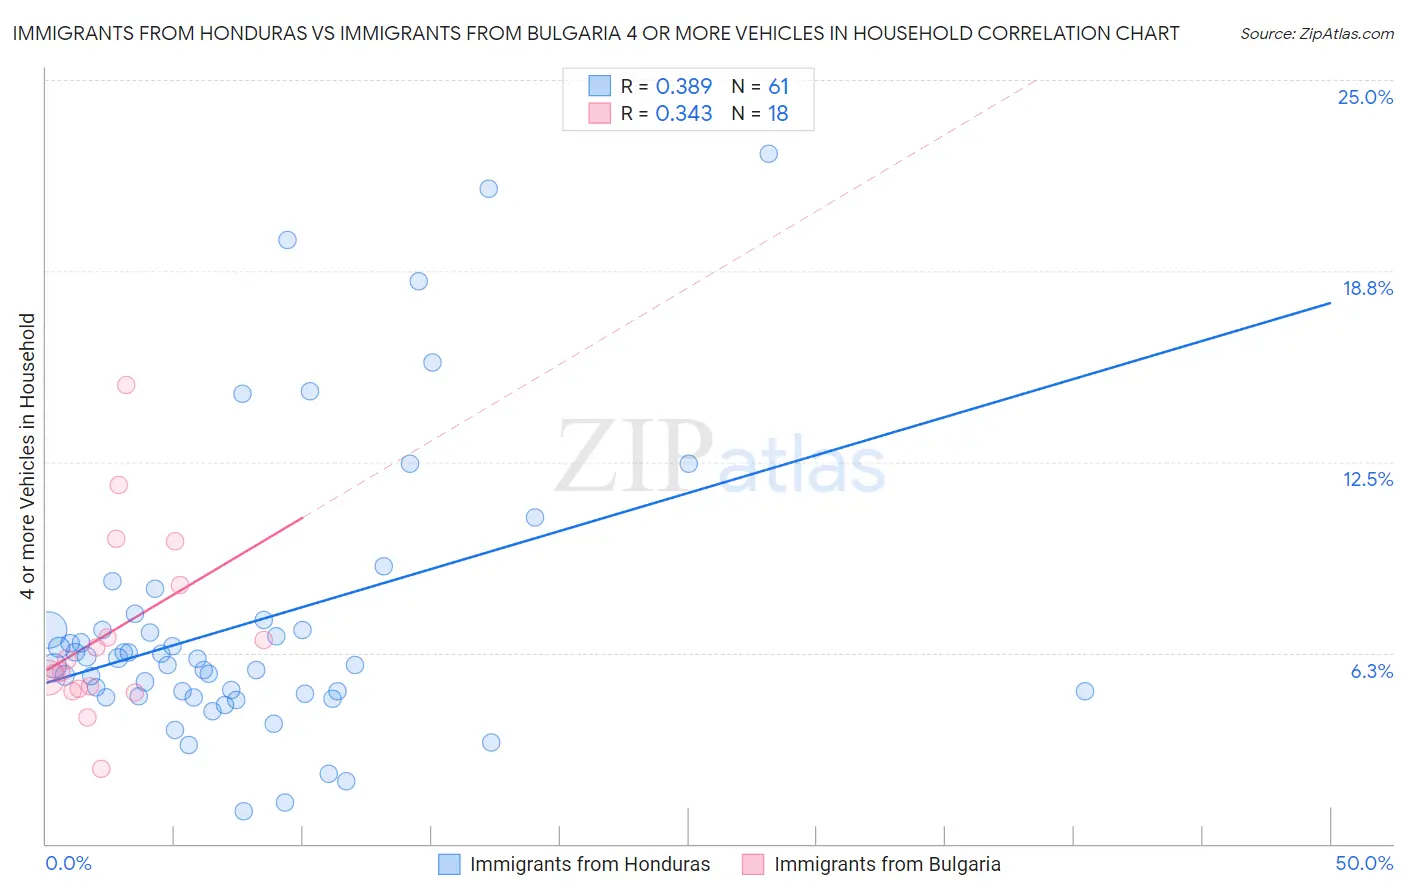
Immigrants from Honduras vs Immigrants from Bulgaria 4 or more Vehicles in Household Correlation Chart
The statistical analysis conducted on geographies consisting of 321,252,543 people shows a mild positive correlation between the proportion of Immigrants from Honduras and percentage of households with 4 or more vehicles available in the United States with a correlation coefficient (R) of 0.389 and weighted average of 6.1%. Similarly, the statistical analysis conducted on geographies consisting of 172,084,774 people shows a mild positive correlation between the proportion of Immigrants from Bulgaria and percentage of households with 4 or more vehicles available in the United States with a correlation coefficient (R) of 0.343 and weighted average of 5.5%, a difference of 10.4%.
4 or more Vehicles in Household Correlation Summary
| Measurement | Immigrants from Honduras | Immigrants from Bulgaria |
| Minimum | 1.1% | 2.5% |
| Maximum | 22.6% | 15.0% |
| Range | 21.5% | 12.5% |
| Mean | 7.3% | 6.9% |
| Median | 6.1% | 5.8% |
| Interquartile 25% (IQ1) | 4.9% | 5.1% |
| Interquartile 75% (IQ3) | 7.2% | 8.4% |
| Interquartile Range (IQR) | 2.3% | 3.4% |
| Standard Deviation (Sample) | 4.6% | 3.0% |
| Standard Deviation (Population) | 4.6% | 3.0% |
Similar Demographics by 4 or more Vehicles in Household
Demographics Similar to Immigrants from Honduras by 4 or more Vehicles in Household
In terms of 4 or more vehicles in household, the demographic groups most similar to Immigrants from Honduras are Immigrants from Nigeria (6.1%, a difference of 0.030%), Immigrants from Zimbabwe (6.0%, a difference of 0.050%), Panamanian (6.0%, a difference of 0.13%), Immigrants from Egypt (6.0%, a difference of 0.15%), and Arab (6.0%, a difference of 0.21%).
| Demographics | Rating | Rank | 4 or more Vehicles in Household |
| Immigrants | South Central Asia | 21.3 /100 | #202 | Fair 6.1% |
| Immigrants | Sierra Leone | 20.5 /100 | #203 | Fair 6.1% |
| Immigrants | Belize | 19.8 /100 | #204 | Poor 6.1% |
| Hondurans | 19.3 /100 | #205 | Poor 6.1% |
| Kenyans | 18.5 /100 | #206 | Poor 6.1% |
| Immigrants | Chile | 16.9 /100 | #207 | Poor 6.1% |
| Immigrants | Nigeria | 15.6 /100 | #208 | Poor 6.1% |
| Immigrants | Honduras | 15.4 /100 | #209 | Poor 6.1% |
| Immigrants | Zimbabwe | 15.1 /100 | #210 | Poor 6.0% |
| Panamanians | 14.8 /100 | #211 | Poor 6.0% |
| Immigrants | Egypt | 14.7 /100 | #212 | Poor 6.0% |
| Arabs | 14.4 /100 | #213 | Poor 6.0% |
| Immigrants | Austria | 14.3 /100 | #214 | Poor 6.0% |
| Immigrants | China | 13.8 /100 | #215 | Poor 6.0% |
| Immigrants | Romania | 13.8 /100 | #216 | Poor 6.0% |
Demographics Similar to Immigrants from Bulgaria by 4 or more Vehicles in Household
In terms of 4 or more vehicles in household, the demographic groups most similar to Immigrants from Bulgaria are Immigrants from Latvia (5.5%, a difference of 0.12%), Cambodian (5.5%, a difference of 0.13%), Black/African American (5.5%, a difference of 0.25%), Macedonian (5.5%, a difference of 0.37%), and Immigrants from Kazakhstan (5.5%, a difference of 0.40%).
| Demographics | Rating | Rank | 4 or more Vehicles in Household |
| Okinawans | 0.6 /100 | #270 | Tragic 5.5% |
| Immigrants | Sudan | 0.6 /100 | #271 | Tragic 5.5% |
| Immigrants | Kazakhstan | 0.6 /100 | #272 | Tragic 5.5% |
| Macedonians | 0.6 /100 | #273 | Tragic 5.5% |
| Blacks/African Americans | 0.6 /100 | #274 | Tragic 5.5% |
| Cambodians | 0.5 /100 | #275 | Tragic 5.5% |
| Immigrants | Latvia | 0.5 /100 | #276 | Tragic 5.5% |
| Immigrants | Bulgaria | 0.5 /100 | #277 | Tragic 5.5% |
| Immigrants | Eastern Europe | 0.4 /100 | #278 | Tragic 5.4% |
| Immigrants | Uruguay | 0.3 /100 | #279 | Tragic 5.4% |
| Alsatians | 0.3 /100 | #280 | Tragic 5.4% |
| Immigrants | Western Africa | 0.3 /100 | #281 | Tragic 5.4% |
| Immigrants | Spain | 0.3 /100 | #282 | Tragic 5.4% |
| Immigrants | Ireland | 0.3 /100 | #283 | Tragic 5.4% |
| Brazilians | 0.3 /100 | #284 | Tragic 5.4% |