Immigrants from Indonesia vs Hispanic or Latino Births to Unmarried Women
COMPARE
Immigrants from Indonesia
Hispanic or Latino
Births to Unmarried Women
Births to Unmarried Women Comparison
Immigrants from Indonesia
Hispanics or Latinos
27.7%
BIRTHS TO UNMARRIED WOMEN
99.5/ 100
METRIC RATING
44th/ 347
METRIC RANK
37.8%
BIRTHS TO UNMARRIED WOMEN
0.0/ 100
METRIC RATING
290th/ 347
METRIC RANK
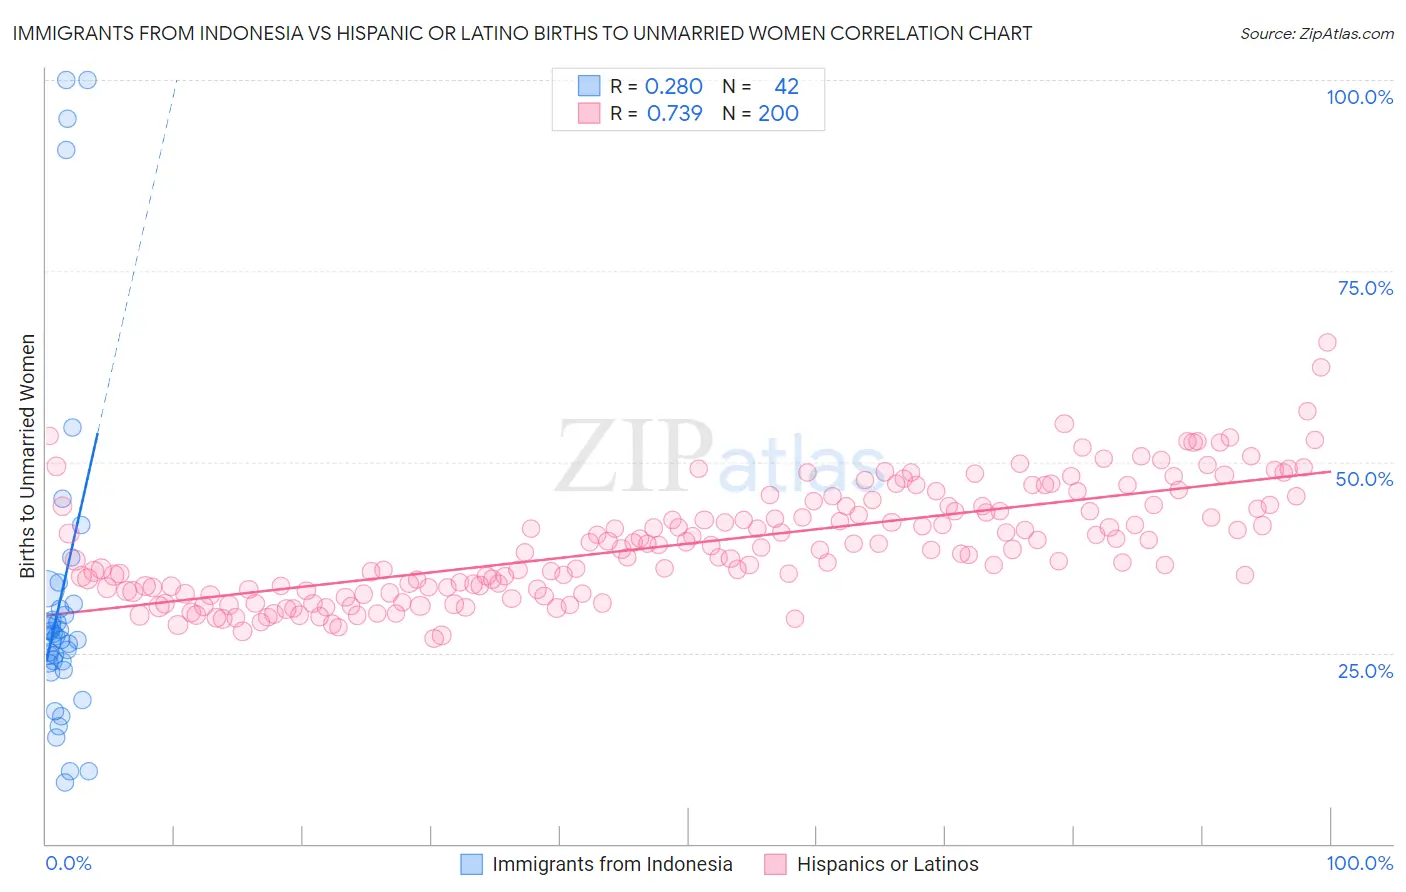
Immigrants from Indonesia vs Hispanic or Latino Births to Unmarried Women Correlation Chart
The statistical analysis conducted on geographies consisting of 207,082,452 people shows a weak positive correlation between the proportion of Immigrants from Indonesia and percentage of births to unmarried women in the United States with a correlation coefficient (R) of 0.280 and weighted average of 27.7%. Similarly, the statistical analysis conducted on geographies consisting of 511,497,668 people shows a strong positive correlation between the proportion of Hispanics or Latinos and percentage of births to unmarried women in the United States with a correlation coefficient (R) of 0.739 and weighted average of 37.8%, a difference of 36.3%.
Births to Unmarried Women Correlation Summary
| Measurement | Immigrants from Indonesia | Hispanic or Latino |
| Minimum | 8.0% | 26.9% |
| Maximum | 100.0% | 65.6% |
| Range | 92.0% | 38.8% |
| Mean | 32.9% | 39.3% |
| Median | 27.0% | 38.7% |
| Interquartile 25% (IQ1) | 23.6% | 33.3% |
| Interquartile 75% (IQ3) | 31.5% | 44.3% |
| Interquartile Range (IQR) | 7.9% | 11.0% |
| Standard Deviation (Sample) | 22.7% | 7.4% |
| Standard Deviation (Population) | 22.4% | 7.4% |
Similar Demographics by Births to Unmarried Women
Demographics Similar to Immigrants from Indonesia by Births to Unmarried Women
In terms of births to unmarried women, the demographic groups most similar to Immigrants from Indonesia are Latvian (27.7%, a difference of 0.090%), Immigrants from Lithuania (27.7%, a difference of 0.14%), Hmong (27.7%, a difference of 0.14%), Eastern European (27.7%, a difference of 0.15%), and Immigrants from Bulgaria (27.6%, a difference of 0.26%).
| Demographics | Rating | Rank | Births to Unmarried Women |
| Immigrants | Ukraine | 99.7 /100 | #37 | Exceptional 27.2% |
| Immigrants | Moldova | 99.7 /100 | #38 | Exceptional 27.3% |
| Immigrants | Malaysia | 99.7 /100 | #39 | Exceptional 27.4% |
| Turks | 99.6 /100 | #40 | Exceptional 27.4% |
| Iraqis | 99.6 /100 | #41 | Exceptional 27.6% |
| Immigrants | Eastern Europe | 99.6 /100 | #42 | Exceptional 27.6% |
| Immigrants | Bulgaria | 99.6 /100 | #43 | Exceptional 27.6% |
| Immigrants | Indonesia | 99.5 /100 | #44 | Exceptional 27.7% |
| Latvians | 99.5 /100 | #45 | Exceptional 27.7% |
| Immigrants | Lithuania | 99.5 /100 | #46 | Exceptional 27.7% |
| Hmong | 99.5 /100 | #47 | Exceptional 27.7% |
| Eastern Europeans | 99.5 /100 | #48 | Exceptional 27.7% |
| Immigrants | Greece | 99.4 /100 | #49 | Exceptional 27.8% |
| Maltese | 99.4 /100 | #50 | Exceptional 27.8% |
| Macedonians | 99.4 /100 | #51 | Exceptional 27.9% |
Demographics Similar to Hispanics or Latinos by Births to Unmarried Women
In terms of births to unmarried women, the demographic groups most similar to Hispanics or Latinos are Alaskan Athabascan (37.7%, a difference of 0.14%), Seminole (37.9%, a difference of 0.34%), Immigrants from Liberia (37.6%, a difference of 0.37%), Blackfeet (37.9%, a difference of 0.39%), and Creek (37.6%, a difference of 0.54%).
| Demographics | Rating | Rank | Births to Unmarried Women |
| Spanish American Indians | 0.0 /100 | #283 | Tragic 37.4% |
| Immigrants | Central America | 0.0 /100 | #284 | Tragic 37.4% |
| Immigrants | Mexico | 0.0 /100 | #285 | Tragic 37.5% |
| Immigrants | Guatemala | 0.0 /100 | #286 | Tragic 37.5% |
| Creek | 0.0 /100 | #287 | Tragic 37.6% |
| Immigrants | Liberia | 0.0 /100 | #288 | Tragic 37.6% |
| Alaskan Athabascans | 0.0 /100 | #289 | Tragic 37.7% |
| Hispanics or Latinos | 0.0 /100 | #290 | Tragic 37.8% |
| Seminole | 0.0 /100 | #291 | Tragic 37.9% |
| Blackfeet | 0.0 /100 | #292 | Tragic 37.9% |
| Immigrants | Nicaragua | 0.0 /100 | #293 | Tragic 38.0% |
| British West Indians | 0.0 /100 | #294 | Tragic 38.0% |
| Iroquois | 0.0 /100 | #295 | Tragic 38.2% |
| Alaska Natives | 0.0 /100 | #296 | Tragic 38.3% |
| Dutch West Indians | 0.0 /100 | #297 | Tragic 38.4% |