Immigrants from Indonesia vs Hispanic or Latino Seniors Poverty Over the Age of 75
COMPARE
Immigrants from Indonesia
Hispanic or Latino
Seniors Poverty Over the Age of 75
Seniors Poverty Over the Age of 75 Comparison
Immigrants from Indonesia
Hispanics or Latinos
12.5%
SENIORS POVERTY OVER THE AGE OF 75
24.4/ 100
METRIC RATING
189th/ 347
METRIC RANK
15.8%
SENIORS POVERTY OVER THE AGE OF 75
0.0/ 100
METRIC RATING
306th/ 347
METRIC RANK
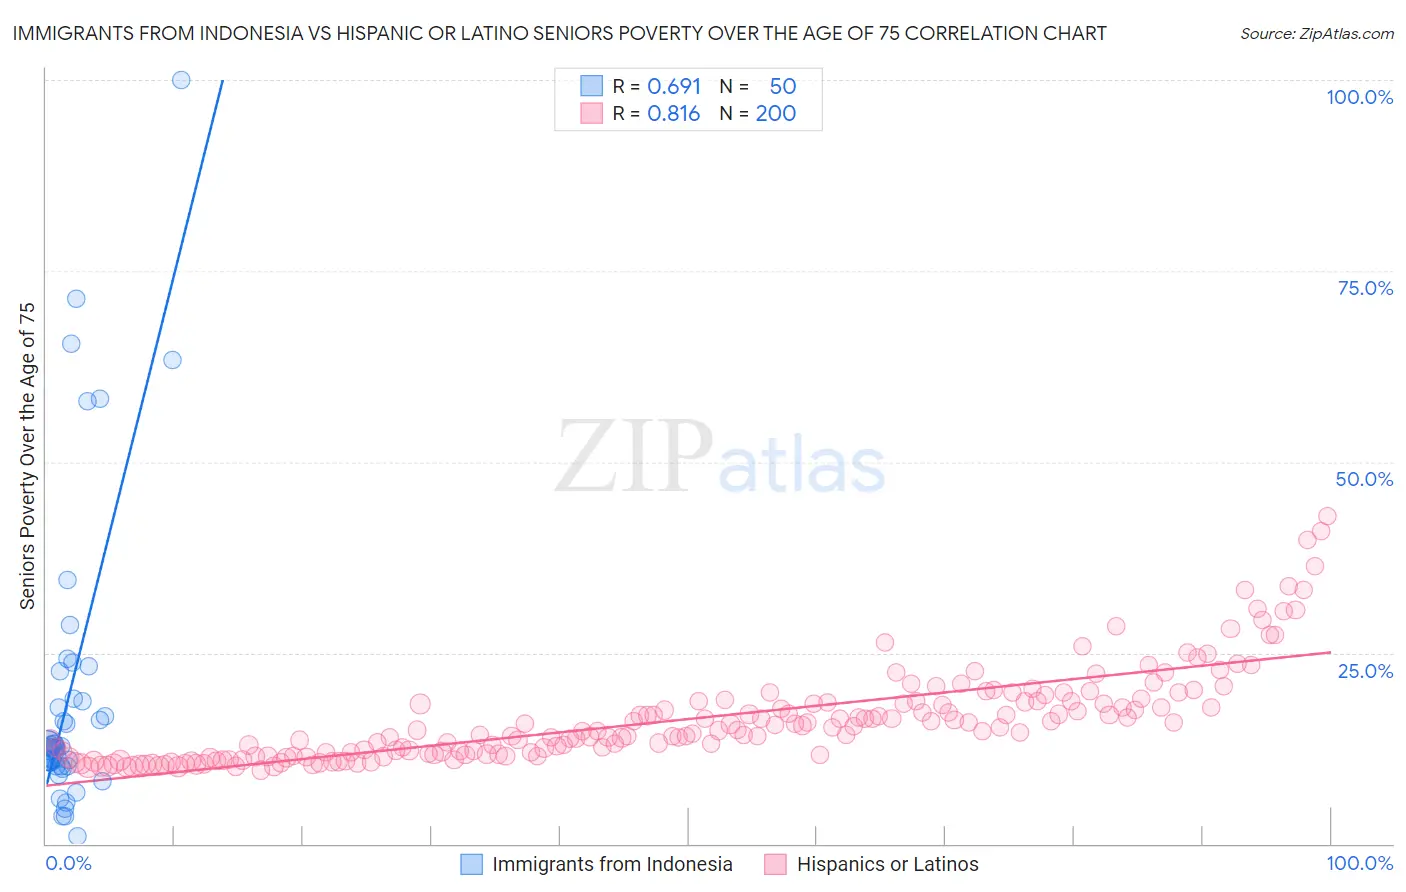
Immigrants from Indonesia vs Hispanic or Latino Seniors Poverty Over the Age of 75 Correlation Chart
The statistical analysis conducted on geographies consisting of 214,419,611 people shows a significant positive correlation between the proportion of Immigrants from Indonesia and poverty level among seniors over the age of 75 in the United States with a correlation coefficient (R) of 0.691 and weighted average of 12.5%. Similarly, the statistical analysis conducted on geographies consisting of 560,283,228 people shows a very strong positive correlation between the proportion of Hispanics or Latinos and poverty level among seniors over the age of 75 in the United States with a correlation coefficient (R) of 0.816 and weighted average of 15.8%, a difference of 26.5%.
Seniors Poverty Over the Age of 75 Correlation Summary
| Measurement | Immigrants from Indonesia | Hispanic or Latino |
| Minimum | 0.93% | 9.6% |
| Maximum | 100.0% | 42.9% |
| Range | 99.1% | 33.3% |
| Mean | 19.9% | 16.3% |
| Median | 12.7% | 14.8% |
| Interquartile 25% (IQ1) | 10.2% | 11.7% |
| Interquartile 75% (IQ3) | 18.9% | 18.5% |
| Interquartile Range (IQR) | 8.7% | 6.8% |
| Standard Deviation (Sample) | 20.1% | 6.2% |
| Standard Deviation (Population) | 19.9% | 6.2% |
Similar Demographics by Seniors Poverty Over the Age of 75
Demographics Similar to Immigrants from Indonesia by Seniors Poverty Over the Age of 75
In terms of seniors poverty over the age of 75, the demographic groups most similar to Immigrants from Indonesia are Immigrants from Congo (12.5%, a difference of 0.060%), Immigrants from Northern Africa (12.5%, a difference of 0.090%), Liberian (12.5%, a difference of 0.13%), Yaqui (12.5%, a difference of 0.15%), and Choctaw (12.5%, a difference of 0.48%).
| Demographics | Rating | Rank | Seniors Poverty Over the Age of 75 |
| German Russians | 41.4 /100 | #182 | Average 12.3% |
| Laotians | 38.2 /100 | #183 | Fair 12.3% |
| Kiowa | 36.0 /100 | #184 | Fair 12.3% |
| Immigrants | Malaysia | 35.8 /100 | #185 | Fair 12.3% |
| Sri Lankans | 32.3 /100 | #186 | Fair 12.4% |
| Yaqui | 25.9 /100 | #187 | Fair 12.5% |
| Immigrants | Northern Africa | 25.2 /100 | #188 | Fair 12.5% |
| Immigrants | Indonesia | 24.4 /100 | #189 | Fair 12.5% |
| Immigrants | Congo | 23.9 /100 | #190 | Fair 12.5% |
| Liberians | 23.2 /100 | #191 | Fair 12.5% |
| Choctaw | 20.2 /100 | #192 | Fair 12.5% |
| Taiwanese | 17.8 /100 | #193 | Poor 12.6% |
| Alsatians | 17.7 /100 | #194 | Poor 12.6% |
| Immigrants | France | 17.4 /100 | #195 | Poor 12.6% |
| Immigrants | Eastern Europe | 16.0 /100 | #196 | Poor 12.6% |
Demographics Similar to Hispanics or Latinos by Seniors Poverty Over the Age of 75
In terms of seniors poverty over the age of 75, the demographic groups most similar to Hispanics or Latinos are Immigrants from West Indies (15.8%, a difference of 0.13%), Ecuadorian (15.7%, a difference of 0.16%), Immigrants from Bangladesh (15.8%, a difference of 0.18%), Immigrants from Trinidad and Tobago (15.7%, a difference of 0.20%), and Immigrants from Honduras (15.7%, a difference of 0.38%).
| Demographics | Rating | Rank | Seniors Poverty Over the Age of 75 |
| Spanish American Indians | 0.0 /100 | #299 | Tragic 15.5% |
| Bahamians | 0.0 /100 | #300 | Tragic 15.5% |
| Immigrants | Latin America | 0.0 /100 | #301 | Tragic 15.6% |
| West Indians | 0.0 /100 | #302 | Tragic 15.7% |
| Immigrants | Honduras | 0.0 /100 | #303 | Tragic 15.7% |
| Immigrants | Trinidad and Tobago | 0.0 /100 | #304 | Tragic 15.7% |
| Ecuadorians | 0.0 /100 | #305 | Tragic 15.7% |
| Hispanics or Latinos | 0.0 /100 | #306 | Tragic 15.8% |
| Immigrants | West Indies | 0.0 /100 | #307 | Tragic 15.8% |
| Immigrants | Bangladesh | 0.0 /100 | #308 | Tragic 15.8% |
| Yup'ik | 0.0 /100 | #309 | Tragic 15.8% |
| Vietnamese | 0.0 /100 | #310 | Tragic 15.9% |
| Trinidadians and Tobagonians | 0.0 /100 | #311 | Tragic 15.9% |
| Crow | 0.0 /100 | #312 | Tragic 15.9% |
| Barbadians | 0.0 /100 | #313 | Tragic 16.0% |