Slovene vs Celtic 4 or more Vehicles in Household
COMPARE
Slovene
Celtic
4 or more Vehicles in Household
4 or more Vehicles in Household Comparison
Slovenes
Celtics
6.3%
4 OR MORE VEHICLES IN HOUSEHOLD
51.1/ 100
METRIC RATING
173rd/ 347
METRIC RANK
7.1%
4 OR MORE VEHICLES IN HOUSEHOLD
99.1/ 100
METRIC RATING
97th/ 347
METRIC RANK
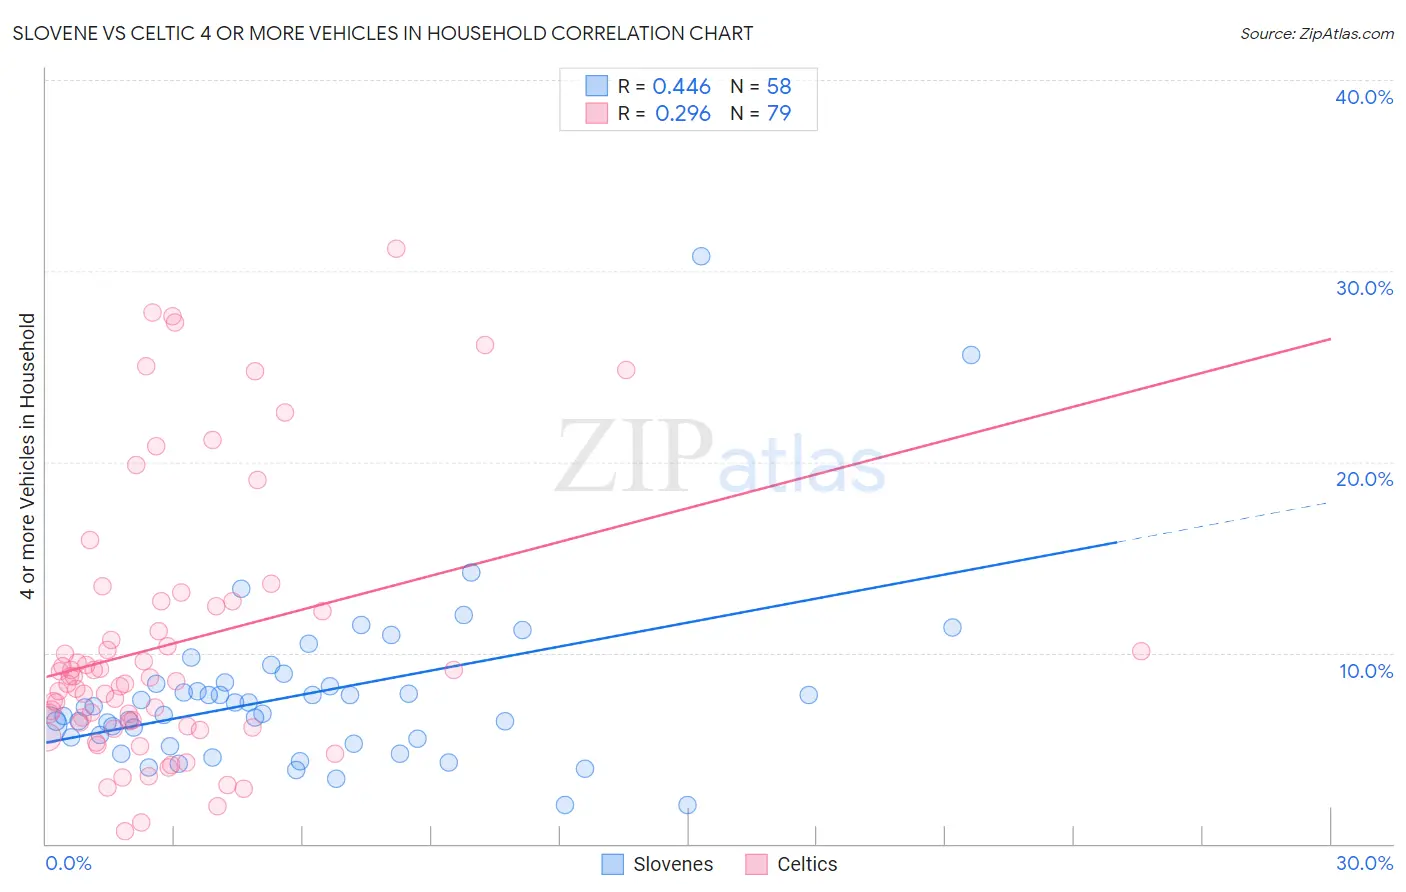
Slovene vs Celtic 4 or more Vehicles in Household Correlation Chart
The statistical analysis conducted on geographies consisting of 260,645,072 people shows a moderate positive correlation between the proportion of Slovenes and percentage of households with 4 or more vehicles available in the United States with a correlation coefficient (R) of 0.446 and weighted average of 6.3%. Similarly, the statistical analysis conducted on geographies consisting of 168,678,221 people shows a weak positive correlation between the proportion of Celtics and percentage of households with 4 or more vehicles available in the United States with a correlation coefficient (R) of 0.296 and weighted average of 7.1%, a difference of 11.9%.
4 or more Vehicles in Household Correlation Summary
| Measurement | Slovene | Celtic |
| Minimum | 2.0% | 0.62% |
| Maximum | 30.8% | 31.2% |
| Range | 28.8% | 30.6% |
| Mean | 7.8% | 10.5% |
| Median | 7.0% | 8.5% |
| Interquartile 25% (IQ1) | 5.5% | 6.1% |
| Interquartile 75% (IQ3) | 8.4% | 12.5% |
| Interquartile Range (IQR) | 2.9% | 6.3% |
| Standard Deviation (Sample) | 4.7% | 7.0% |
| Standard Deviation (Population) | 4.6% | 7.0% |
Similar Demographics by 4 or more Vehicles in Household
Demographics Similar to Slovenes by 4 or more Vehicles in Household
In terms of 4 or more vehicles in household, the demographic groups most similar to Slovenes are Immigrants from Lebanon (6.3%, a difference of 0.060%), Immigrants from India (6.3%, a difference of 0.080%), Lithuanian (6.3%, a difference of 0.12%), Immigrants from Syria (6.3%, a difference of 0.16%), and Immigrants from Western Europe (6.3%, a difference of 0.24%).
| Demographics | Rating | Rank | 4 or more Vehicles in Household |
| Immigrants | Denmark | 57.8 /100 | #166 | Average 6.4% |
| Poles | 56.9 /100 | #167 | Average 6.4% |
| Lebanese | 55.8 /100 | #168 | Average 6.4% |
| Estonians | 55.1 /100 | #169 | Average 6.4% |
| Immigrants | Syria | 52.8 /100 | #170 | Average 6.3% |
| Immigrants | India | 51.9 /100 | #171 | Average 6.3% |
| Immigrants | Lebanon | 51.7 /100 | #172 | Average 6.3% |
| Slovenes | 51.1 /100 | #173 | Average 6.3% |
| Lithuanians | 50.0 /100 | #174 | Average 6.3% |
| Immigrants | Western Europe | 48.8 /100 | #175 | Average 6.3% |
| Ukrainians | 47.6 /100 | #176 | Average 6.3% |
| Slovaks | 46.9 /100 | #177 | Average 6.3% |
| Belizeans | 44.5 /100 | #178 | Average 6.3% |
| Immigrants | Japan | 43.1 /100 | #179 | Average 6.3% |
| Syrians | 42.0 /100 | #180 | Average 6.3% |
Demographics Similar to Celtics by 4 or more Vehicles in Household
In terms of 4 or more vehicles in household, the demographic groups most similar to Celtics are Central American (7.1%, a difference of 0.35%), Czechoslovakian (7.1%, a difference of 0.37%), Irish (7.1%, a difference of 0.42%), Dutch West Indian (7.1%, a difference of 0.58%), and Immigrants from Afghanistan (7.1%, a difference of 0.59%).
| Demographics | Rating | Rank | 4 or more Vehicles in Household |
| Creek | 99.6 /100 | #90 | Exceptional 7.2% |
| Assyrians/Chaldeans/Syriacs | 99.4 /100 | #91 | Exceptional 7.2% |
| Immigrants | Latin America | 99.4 /100 | #92 | Exceptional 7.1% |
| Immigrants | Afghanistan | 99.3 /100 | #93 | Exceptional 7.1% |
| Dutch West Indians | 99.3 /100 | #94 | Exceptional 7.1% |
| Czechoslovakians | 99.3 /100 | #95 | Exceptional 7.1% |
| Central Americans | 99.3 /100 | #96 | Exceptional 7.1% |
| Celtics | 99.1 /100 | #97 | Exceptional 7.1% |
| Irish | 99.0 /100 | #98 | Exceptional 7.1% |
| Seminole | 98.8 /100 | #99 | Exceptional 7.0% |
| Taiwanese | 98.7 /100 | #100 | Exceptional 7.0% |
| Pakistanis | 98.7 /100 | #101 | Exceptional 7.0% |
| Asians | 98.6 /100 | #102 | Exceptional 7.0% |
| Blackfeet | 98.6 /100 | #103 | Exceptional 7.0% |
| Hmong | 98.3 /100 | #104 | Exceptional 7.0% |